Qantas 2010 Annual Report Download - page 113
Download and view the complete annual report
Please find page 113 of the 2010 Qantas annual report below. You can navigate through the pages in the report by either clicking on the pages listed below, or by using the keyword search tool below to find specific information within the annual report.-
 1
1 -
2
-
3
-
4
-
5
-
6
-
7
-
8
-
9
-
10
-
11
-
12
-
13
-
14
-
15
-
16
-
17
-
18
-
19
-
20
-
21
-
22
-
23
-
24
-
25
-
26
-
27
-
28
-
29
-
30
-
31
-
32
-
33
-
34
-
35
-
36
-
37
-
38
-
39
-
40
-
41
-
42
-
43
-
44
-
45
-
46
-
47
-
48
-
49
-
50
-
51
-
52
-
53
-
54
-
55
-
56
-
57
-
58
-
59
-
60
-
61
-
62
-
63
-
64
-
65
-
66
-
67
-
68
-
69
-
70
-
71
-
72
-
73
-
74
-
75
-
76
-
77
-
78
-
79
-
80
-
81
-
82
-
83
-
84
-
85
-
86
-
87
-
88
-
89
-
90
-
91
-
92
-
93
-
94
-
95
-
96
-
97
-
98
-
99
-
100
-
101
-
102
-
 103
103 -
 104
104 -
 105
105 -
 106
106 -
 107
107 -
 108
108 -
 109
109 -
 110
110 -
 111
111 -
 112
112 -
 113
113 -
 114
114 -
 115
115 -
 116
116 -
 117
117 -
 118
118 -
 119
119 -
 120
120
 |
 |

111 ANNUAL REPORT 2010
1. For information on the Global Reporting Initiative (GRI) indicators, refer to the GRI G3 Reporting Framework for Sustainability Reporting,
www.globalreporting.org.
2. There were no aviation fatalities or OHS fatalities in 2009/2010.
3. Reported statistic has been expanded in 2009/2010 for the Qantas Group. This includes Jetstar, QantasLink, Jetconnect, CaterAir Riverside
and CaterAir Cairns. It also includes absenteeism data for the Jetset Travelworld Group.
4. In 2009/2010, Qantas absenteeism includes carer’s leave and has been expanded to include Jetconnect, Cater Air Riverside and CaterAir
Cairns. Absenteeism data previously reported in 2008/2009 is not comparable due to the revised de nition.
5. New statistics for 2009/2010. For de nitions refer to pages 112–113.
6. On-time performance has been expanded in 2009/2010 to include on-time performance indicators for the Group’s domestic operations.
These statistics have been previously reported to the Bureau of Infrastructure, Transport and Regional Economics (BITRE).
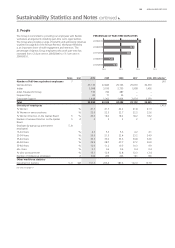
7. Full-time equivalent (FTE) categories have been revised from those reported in 2008/2009 to re ect the current Qantas Group operating
structure. In 2009/2010, Qantas Airlines include the aggregation of Qantas, QantasLink, Airports, Engineering, Flight Training, Freight and
Jetset Travelworld Group for 2009/2010 include Qantas Holidays.
8. % by age group has replaced previously reported statistics, average age and % eligible for retirement in the next ve years, which were
reported in the 2008/2009 Qantas Annual Report. Understanding the changing demographics of the workforce assists in workplace planning.
9. Training associated with the introduction of the new Airbus A380 eet and an increase in the A330 eet in 2008/2009 represents the majority
of the difference between 2008/2009 and 2009/2010.
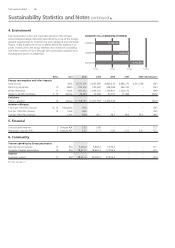
10. 2009, 2008 and 2007 restated to re ect the revised de nition to include the total amount of electricity separately metered and under Qantas’
control and in uence through its bill payment processes. Variance difference for each year is less than 0.2 per cent. Data provided from 2007
only as this represents the base year for the 2011 improvement target of a 10 per cent reduction in electricity consumption by 2011.
11. 2009, 2008 and 2007 restated to re ect the revised de nition to include the total amount of water separately metered and under Qantas’
control and in uence through its bill payment processes. Variance decrease of 2.3 per cent in 2009, 0.7 per cent in 2008 and 1 per cent in
2007. Data provided from 2007 only as this represents the base year for the 2011 improvement target of a 25 per cent reduction in water
consumption by 2011.
12. Waste to land ll includes solid waste and quarantine waste. Data has been provided from 2006/2007 only as this represents the base year
for the 2011 improvement target of a 25 per cent reduction in waste to land ll by June 2011.
13. The Qantas Group uses emission factors recommended by the Australian Government’s Department of Climate Change methodology.
Emission factors are from the National Greenhouse Accounts (NGA) Factors (July 2010).
14. Reported statistics have been expanded to report Group revenue tonne kilometre (RTK) measures which include Jetstar and QantasLink
operations. In prior years, CO2-e per 100 RTK and Fuel per 100 RTK were reported for Qantas Airlines only.
15. In 2009/2010, calculated as 1,639,728 inbound visitors brought to Australia by Qantas and Jetstar between June 2009 and May 2010 which is
the latest data available (source: Australian Bureau of Statistics) multiplied by average visitor expenditure of $3,297 (source: Tourism Australia’s
March 2010 International Visitor Survey). This amount does not include the value of airfare and freight charges that accrue to Qantas from
overseas sources which also represent export revenue.
16. In 2009/2010, calculated as 29,148,000 domestic passengers carried by the Qantas Group between June 2009 and May 2010 for all ights
within Australia multiplied by average visitor spending of $649 (source: Tourism Australia’s March 2010 National Visitor Survey). This amount
includes the value of related airfares. As it is not possible to disaggregate the data, the calculations should be viewed as indicative only e.g.
the gure may include some international visitor expenditure (where domestic ights are purchased after arrival in Australia) or understate the
expenditure associated with domestic ights which are “round trip”.
17. In 2009/2010, calculated as $13,772 million Qantas Group revenue multiplied by Qantas Group economic multiplier of 2.1 (as calculated by
Access Economics, April 2008 in a report to Qantas). The multiplier is derived from Australian Bureau of Statistics input-output tables of the
Australian economy.
Sustainability Statistics and Notes continued