Qantas 2010 Annual Report Download - page 18
Download and view the complete annual report
Please find page 18 of the 2010 Qantas annual report below. You can navigate through the pages in the report by either clicking on the pages listed below, or by using the keyword search tool below to find specific information within the annual report.-
 1
1 -
2
-
3
-
4
-
5
-
6
-
7
-
 8
8 -
 9
9 -
 10
10 -
 11
11 -
 12
12 -
 13
13 -
 14
14 -
 15
15 -
 16
16 -
 17
17 -
 18
18 -
 19
19 -
 20
20 -
 21
21 -
 22
22 -
 23
23 -
 24
24 -
 25
25 -
 26
26 -
 27
27 -
 28
28 -
29
-
30
-
31
-
32
-
33
-
34
-
35
-
36
-
37
-
38
-
39
-
40
-
41
-
42
-
43
-
44
-
45
-
46
-
47
-
48
-
49
-
50
-
51
-
52
-
53
-
54
-
55
-
56
-
57
-
58
-
59
-
60
-
61
-
62
-
63
-
64
-
65
-
66
-
67
-
68
-
69
-
70
-
71
-
72
-
73
-
74
-
75
-
76
-
77
-
78
-
79
-
80
-
81
-
82
-
83
-
84
-
85
-
86
-
87
-
88
-
89
-
90
-
91
-
92
-
93
-
94
-
95
-
96
-
97
-
98
-
99
-
100
-
101
-
102
-
103
-
104
-
105
-
106
-
107
-
108
-
109
-
110
-
111
-
112
-
113
-
114
-
115
-
116
-
117
-
118
-
119
-
120
 |
 |

THE QANTAS GROUP 16
for the year ended 30 June 2010
Review of Operations
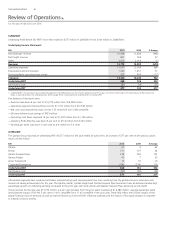
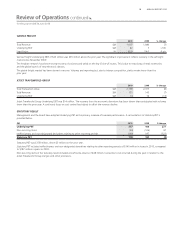
SUMMARY
Underlying Pro t Before Tax (PBT)1 more than tripled to $377 million in 2009/2010 from $100 million in 2008/2009.
Underlying Income Statement
$M 2010 2009 $ change
Net passenger revenue 10,938 11,604 (666)
Net freight revenue 821 764 57
Other 2,013 2,014 (1)
Revenue 13,772 14,382 (610)
Operating expenses 11,577 12,545 968
Depreciation and amortisation 1,200 1,251 51
Non-cancellable operating lease rentals 527 450 (77)
Expenses 13,304 14,246 942
Underlying EBIT 468 136 332
Net nance costs (91) (36) (55)
Underlying PBT 377 100 277
1. Underlying PBT is the primary measure used by Management and the Board to assess the nancial performance of the Group. All nancial information in the table above and the commentary
below is adjusted to re ect the underlying result. Refer to page 59 for a reconciliation of Underlying PBT to Statutory PBT.
Key features of this result were:
—Revenue was down 4 per cent to $13,772 million from $14,382 million
—Operating expenses improved 8 per cent to $11,577 million from $12,545 million
—Net unit costs improved by 4 per cent to 5.55 cents/ASK from 5.80 cents/ASK
—QFuture delivered cost savings of $533 million
—Operating cash ows improved 14 per cent to $1,307 million from $1,149 million
—Statutory Pro t After Tax was down 6 per cent to $116 million from $123 million
—Earnings per share was down 13 per cent to 4.9 cents from 5.6 cents
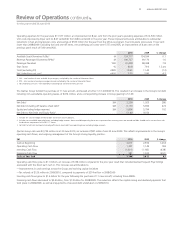
OVERVIEW
The Qantas Group reported an Underlying PBT of $377 million for the year ended 30 June 2010, an increase of 277 per cent on the previous year’s
result of $100 million.
$M 2010 2009 $ change
Qantas 67 4 63
Jetstar 131 107 24
Qantas Frequent Flyer 328 226 102
Qantas Freight 42 7 35
Jetset Travelworld 14 16 (2)
Corporate/Eliminations (114) (224) 110
Underlying EBIT 468 136 332
Net nance costs (91) (36) (55)
Underlying PBT 377 100 277
All business segments have remained pro table, demonstrating yield improvements from lows resulting from the global economic downturn and
robust cost saving achievements for the year. The Qantas, Jetstar, Qantas Freight and Qantas Frequent Flyer businesses have all delivered double digit
percentage growth in underlying earnings compared to the prior year, with both Jetstar and Qantas Frequent Flyer delivering record results.
Group revenue for the year was $13,772 million, a 4 per cent decrease from the prior year’s revenues of $14,382 million. Average passenger yields
(excluding the impact of FX) fell 7 per cent to 10.61 cents/RPK from 11.43 cents/RPK in the prior year. These falls re ect the full year impact of the
global nancial crisis on demand, as well as external factors such as the H1N1 in uenza outbreak and the closure of European airspace in response
to Icelandic volcanic activity.