Qantas 2010 Annual Report Download - page 109
Download and view the complete annual report
Please find page 109 of the 2010 Qantas annual report below. You can navigate through the pages in the report by either clicking on the pages listed below, or by using the keyword search tool below to find specific information within the annual report.-
 1
1 -
2
-
3
-
4
-
5
-
6
-
7
-
8
-
9
-
10
-
11
-
12
-
13
-
14
-
15
-
16
-
17
-
18
-
19
-
20
-
21
-
22
-
23
-
24
-
25
-
26
-
27
-
28
-
29
-
30
-
31
-
32
-
33
-
34
-
35
-
36
-
37
-
38
-
39
-
40
-
41
-
42
-
43
-
44
-
45
-
46
-
47
-
48
-
49
-
50
-
51
-
52
-
53
-
54
-
55
-
56
-
57
-
58
-
59
-
60
-
61
-
62
-
63
-
64
-
65
-
66
-
67
-
68
-
69
-
70
-
71
-
72
-
73
-
74
-
75
-
76
-
77
-
78
-
79
-
80
-
81
-
82
-
83
-
84
-
85
-
86
-
87
-
88
-
89
-
90
-
91
-
92
-
93
-
94
-
95
-
96
-
97
-
98
-
 99
99 -
 100
100 -
 101
101 -
 102
102 -
 103
103 -
 104
104 -
 105
105 -
 106
106 -
 107
107 -
 108
108 -
 109
109 -
 110
110 -
 111
111 -
 112
112 -
 113
113 -
 114
114 -
 115
115 -
 116
116 -
 117
117 -
 118
118 -
 119
119 -
120
 |
 |
107 ANNUAL REPORT 2010
Sustainability Statistics and Notes
SUSTAINABILITY REPORTING APPROACH
The Qantas Group (Group) has adopted an investor approach to
sustainability, which includes embracing opportunities and managing risks
to achieve sustainable growth in returns to shareholders. This investor
approach includes a commitment to managing and reporting on
Environment, Social and Governance (ESG) performance.
This is the Group’s fourth sustainability report and continues the approach
of previous years to move towards a fully integrated approach where the
Group’s sustainability issues, performance and programs are integrated
throughout the Report and supplemented by the Sustainability Statistics
and Notes outlined below. The Annual Report is aimed at a wide
stakeholder audience: including investors, employees, customers, suppliers,
government, nanciers and various special interest groups. This
information is supplemented by a dedicated Environment, Social and
Governance (ESG) section in the Qantas Investor Data Book, which is
speci cally tailored to an investor audience.
Following the new Management team’s re nement of the Group’s vision
and strategy in 2008/2009, 2009/2010 presented an opportunity to
better align the Group’s approach to sustainability to business strategy
and the drivers of value for the Group. The Group’s overall sustainability
strategy is integrated within the Group’s business strategy. There is no
stand-alone sustainability strategy.
SUSTAINABILITY REPORTING SCOPE
The selection of content and key performance statistics also re ects the
revised approach. The number of sustainability indicators has been
reduced in 2009/2010 to better align to the Group’s strategy and to
focus on those indicators which support the goal of sustainable growth
in returns to shareholders and cover material impact areas including
nancial and economic, health and safety, environment and social
(including our people, customers and the wider community). De nitions
for each of the performance statistics are provided on pages 112–113.
While the Group continues to seek guidance from a range of voluntary
sustainability frameworks such as the Global Reporting Initiative G3
Sustainability Reporting Guidelines (www.globalreporting.org), the main
focus of the Group’s sustainability reporting is to demonstrate to
stakeholders that sustainability is integrated with the Group’s strategy
and operations.
The sustainability information and performance statistics in this report
apply to all wholly-owned operations of the Qantas Group globally for
the 2009/2010 nancial year unless otherwise indicated. Approximately
92% of employees (based on full-time equivalents) are based in
Australia.
FEEDBACK
Feedback on the sustainability information presented in the Annual Report
and the ESG section of the Investor Data Book is encouraged. Please
contact the Qantas Group by writing to [email protected].
ASSURANCE
The KPMG Independent Limited Assurance Report on page 115 is with
respect to the indicators within the performance statistics table for the
current year 2009/2010.
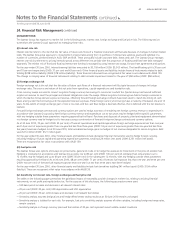
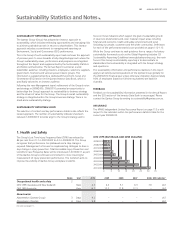
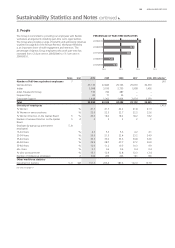
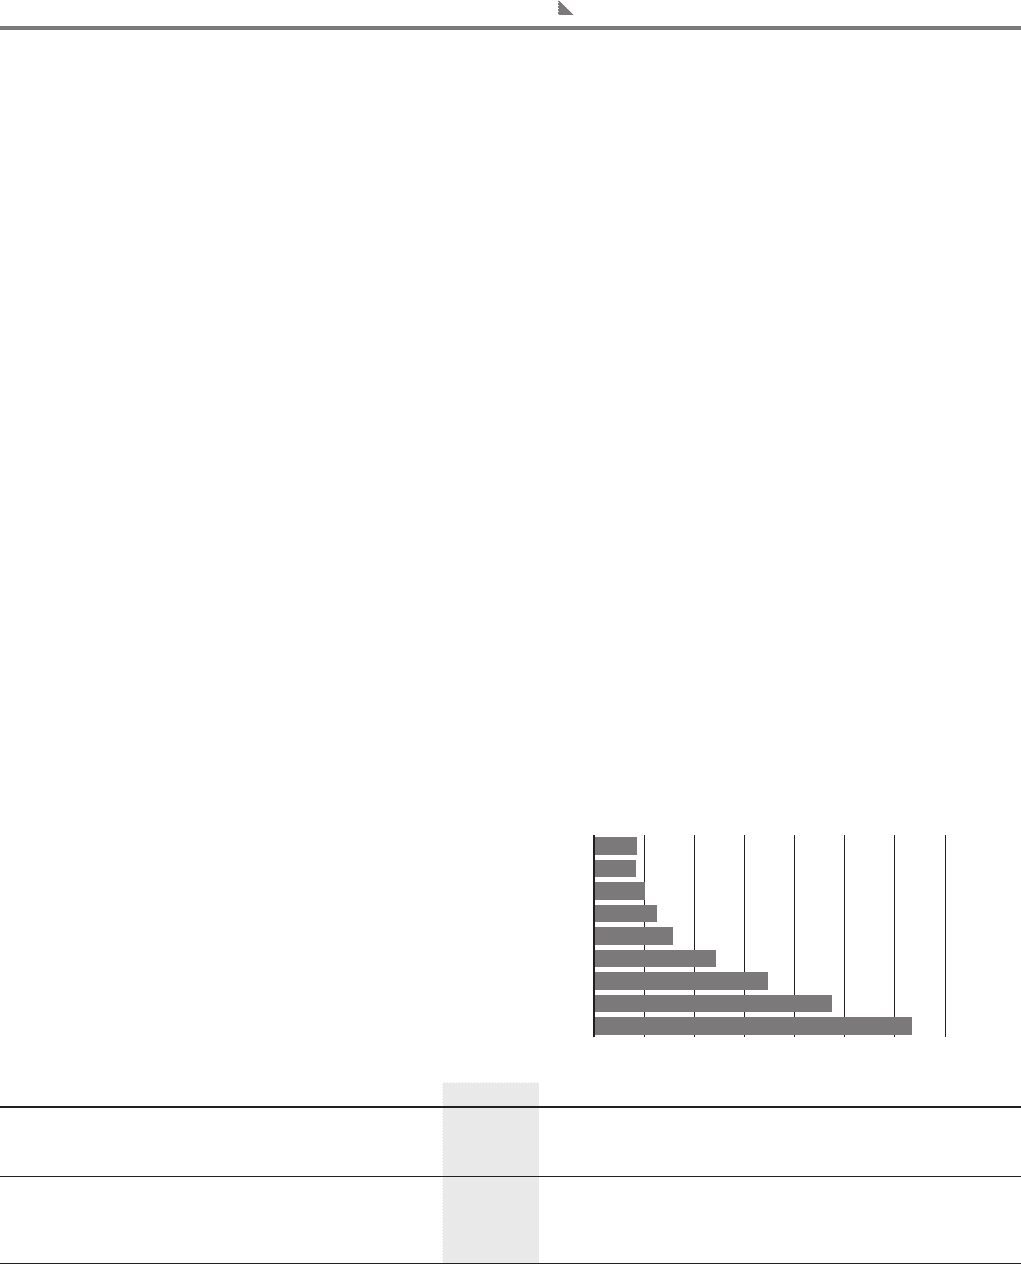
1. Health and Safety
The Group’s Lost Time Injury Frequency Rate (LTIFR) has reduced by
86 per cent from 31.7 in 2001/2002 to 4.3 in 2009/2010. The Group
recognises that performance has plateaued and a step change is
required. Management is focused on implementing strategies to drive a
step change in injury prevention. Total Recordable Injury Prevention and
Lost Work Case Frequency Rates will be introduced in 2010/2011 as part
of the Qantas Group’s continued commitment to more meaningful
measurement of injury prevention performance. This transition aims to
improve the visibility of Qantas Group workplace incidents.
OHS LTIFR (AUSTRALIA AND NEW ZEALAND)
Notes Unit 2010 2009 2008 2007 2006 GRI indicator1
Occupational health and safety 2
OHS LTIFR (Australia and New Zealand) Rate 4.3 4.2 5.1 6.3 7.9 LA7
OHS SIFR (Australia) Rate 14.2 13.5 12.8 12.3 – LA7
Absenteeism
Absenteeism (Qantas Group) 3 Days 9.2 – – – – LA7
Absenteeism (Qantas) 4 Days 9.8 – – – – LA7
For notes see page 111.
0 5 10 15 20 25 30 35
2009/2010
2008/2009
2007/2008
2006/2007
2005/2006
2004/2005
2003/2004
2001/2002
2002/2003
4.3
4.2
5.1
6.3
7.9
12.2
17.4
23.7
31.7