Qantas 2010 Annual Report Download - page 69
Download and view the complete annual report
Please find page 69 of the 2010 Qantas annual report below. You can navigate through the pages in the report by either clicking on the pages listed below, or by using the keyword search tool below to find specific information within the annual report.-
 1
1 -
2
-
3
-
4
-
5
-
6
-
7
-
8
-
9
-
10
-
11
-
12
-
13
-
14
-
15
-
16
-
17
-
18
-
19
-
20
-
21
-
22
-
23
-
24
-
25
-
26
-
27
-
28
-
29
-
30
-
31
-
32
-
33
-
34
-
35
-
36
-
37
-
38
-
39
-
40
-
41
-
42
-
43
-
44
-
45
-
46
-
47
-
48
-
49
-
50
-
51
-
52
-
53
-
54
-
55
-
56
-
57
-
58
-
 59
59 -
 60
60 -
 61
61 -
 62
62 -
 63
63 -
 64
64 -
 65
65 -
 66
66 -
 67
67 -
 68
68 -
 69
69 -
 70
70 -
 71
71 -
 72
72 -
 73
73 -
 74
74 -
 75
75 -
 76
76 -
 77
77 -
 78
78 -
 79
79 -
80
-
81
-
82
-
83
-
84
-
85
-
86
-
87
-
88
-
89
-
90
-
91
-
92
-
93
-
94
-
95
-
96
-
97
-
98
-
99
-
100
-
101
-
102
-
103
-
104
-
105
-
106
-
107
-
108
-
109
-
110
-
111
-
112
-
113
-
114
-
115
-
116
-
117
-
118
-
119
-
120
 |
 |
67 ANNUAL REPORT 2010
for the year ended 30 June 2010
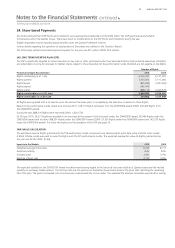
Notes to the Financial Statements continued
Qantas Group
2010
$M
2009
$M
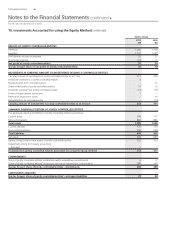
RESULTS OF ASSOCIATES
Revenues 489 688
Expenses 538 770
Loss before income tax expense (49) (82)
Income tax bene t 12 6
Net loss of associates (37) (76)
Qantas Group’s share of net loss of associates (14) (25)
MOVEMENTS IN CARRYING AMOUNT OF INVESTMENTS IN ASSOCIATES
Carrying amount of investments in associates as at 1 July 76 109
Additional investment in associates 10 23
Share of net loss of associates (14) (25)
Dividends received from associates (3) (5)
Share of foreign currency translation reserve movements (10) –
Share of hedge reserve movements 6 (8)
Impairment of investment – (15)
Reclassi cation to controlled entity – (3)
Carrying amount of investments in associates as at 30 June 65 76
SUMMARY FINANCIAL POSITION OF ASSOCIATES
The aggregate assets and liabilities of associates is as follows:
Current assets 135 175
Non-current assets 184 222
Total assets 319 397
Current liabilities 187 234
Non-current liabilities 23 55
Total liabilities 210 289
Net assets 109 108
Qantas Group’s share of net assets of associates 37 41
Adjustment arising from equity accounting
—Goodwill 40 47
—Accumulated impairment (12) (12)
Investments in associates accounted for using the equity method 65 76
COMMITMENTS
Share of associates’ contracted capital expenditure commitments 1,070 995
Share of associates’ contracted non-capital expenditure commitments 54 46
Qantas Group’s share of associates’ commitments 1,124 1,041
CONTINGENT LIABILITIES
Qantas Group’s share of associates’ contingent liabilities 8 5
(B) INVESTMENTS IN JOINTLY CONTROLLED ENTITIES
Details of interests in jointly controlled entities are as follows:
Qantas Group
Ownership Interest
Principal Activity Country of Incorporation Balance Date
2010
%
2009
%
Australian air Express Pty Ltd Air cargo Australia 30 Jun 50 50
Harvey Holidays Pty Ltd Tours and travel Australia 30 Jun 50 50
LTQ Engineering Pty Limited (formerly
known as Jet Turbine Services Pty Limited)
Maintenance services Australia 30 Jun 50 50
Star Track Express Holdings Pty Limited Express road freight Australia 30 Jun 50 50
15. Investments Accounted for using the Equity Method continued