Qantas 2010 Annual Report Download - page 62
Download and view the complete annual report
Please find page 62 of the 2010 Qantas annual report below. You can navigate through the pages in the report by either clicking on the pages listed below, or by using the keyword search tool below to find specific information within the annual report.-
 1
1 -
2
-
3
-
4
-
5
-
6
-
7
-
8
-
9
-
10
-
11
-
12
-
13
-
14
-
15
-
16
-
17
-
18
-
19
-
20
-
21
-
22
-
23
-
24
-
25
-
26
-
27
-
28
-
29
-
30
-
31
-
32
-
33
-
34
-
35
-
36
-
37
-
38
-
39
-
40
-
41
-
42
-
43
-
44
-
45
-
46
-
47
-
48
-
49
-
50
-
51
-
 52
52 -
 53
53 -
 54
54 -
 55
55 -
 56
56 -
 57
57 -
 58
58 -
 59
59 -
 60
60 -
 61
61 -
 62
62 -
 63
63 -
 64
64 -
 65
65 -
 66
66 -
 67
67 -
 68
68 -
 69
69 -
 70
70 -
 71
71 -
 72
72 -
73
-
74
-
75
-
76
-
77
-
78
-
79
-
80
-
81
-
82
-
83
-
84
-
85
-
86
-
87
-
88
-
89
-
90
-
91
-
92
-
93
-
94
-
95
-
96
-
97
-
98
-
99
-
100
-
101
-
102
-
103
-
104
-
105
-
106
-
107
-
108
-
109
-
110
-
111
-
112
-
113
-
114
-
115
-
116
-
117
-
118
-
119
-
120
 |
 |

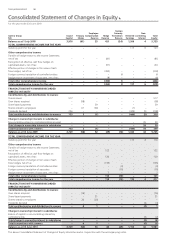
THE QANTAS GROUP 60
for the year ended 30 June 2010
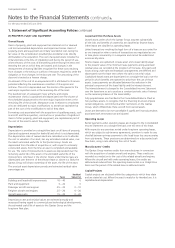
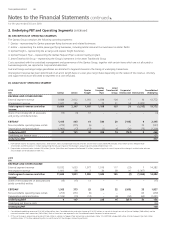
Notes to the Financial Statements continued
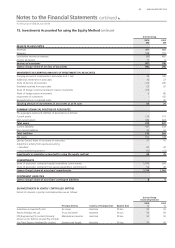
(B) DESCRIPTION OF OPERATING SEGMENTS
The Qantas Group comprises the following operating segments:
1. Qantas – representing the Qantas passenger ying businesses and related businesses
2. Jetstar – representing the Jetstar passenger ying businesses, including Jetstar Asia and the investment in Jetstar Paci c
3. Qantas Freight – representing the air cargo and express freight businesses
4. Qantas Frequent Flyer – representing the Qantas Frequent Flyer customer loyalty program
5. Jetset Travelworld Group – representing the Group’s investment in the Jetset Travelworld Group
Costs associated with the centralised management and governance of the Qantas Group, together with certain items which are not allocated to
business segments, are reported as Corporate/Unallocated.
Fuel and foreign exchange hedge gains/losses are allocated to Segments based on the timing of underlying transactions.
Intersegment revenue has been determined on an arm’s length basis or a cost plus margin basis depending on the nature of the revenue. Ancillary
and support services are allocated to segments on a cost only basis.
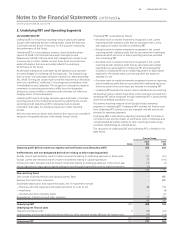
(C) ANALYSIS BY OPERATING SEGMENT
2010
$M Qantas Jetstar
Qantas
Freight
Qantas
Frequent
Flyer
Jetset
Travelworld
Group
Corporate/
Unallocated Eliminations
Consolidated
Underlying
REVENUE AND OTHER INCOME
External segment revenue 9,588 2,012 1,003 1,038 104 17 10 13,772
Intersegment revenue 1,021 185 4 70 31 14 (1,325) –
Total segment revenue and other
income
10,609 2,197 1,007 1,108 135 31 (1,315) 13,772
Share of net (loss)/pro t of associates
and jointly controlled entities
(13) (3) 12 – – – – (4)
EBITDAR11,415 463 61 330 20 (103) 9 2,195
Non-cancellable operating lease rentals (279) (315) (6) – – – 73 (527)
Depreciation and amortisation2(1,069) (17) (13) (2) (6) (20) (73) (1,200)
Underlying EBIT 67 131 42 328 14 (123) 9 468
Underlying net nance costs (91)
Underlying PBT 377
1. Pro t before income tax expense, depreciation, amortisation, non-cancellable operating lease rentals and net nance costs (EBITDAR) includes $153 million (Qantas Frequent Flyer
$152 million and Eliminations $1 million) representing the full year impact of the change in accounting estimate described in Note 1(C).
2. Depreciation and amortisation includes $50 million (Qantas $48 million and Corporate/Unallocated $2 million) representing the six month impact of the change in residual value estimate
for passenger aircraft described in Note 1(C).
2009
$M
REVENUE AND OTHER INCOME
External segment revenue 10,532 1,653 1,077 1,019 117 (23) 7 14,382
Intersegment revenue 1,092 198 3 30 28 16 (1,367) –
Total segment revenue and other
income1
11,624 1,851 1,080 1,049 145 (7) (1,360) 14,382
Share of net (loss)/pro t of associates and
jointly controlled entities
(13) (15) 13 – – – – (15)
EBITDAR21,363 373 25 226 22 (205) 33 1,837
Non-cancellable operating lease rentals (253) (251) (6) – – – 60 (450)
Depreciation and amortisation (1,106) (15) (12) – (6) (52) (60) (1,251)
Underlying EBIT 4 107 7 226 16 (257) 33 136
Underlying net nance costs (36)
Underlying PBT 100
1. Consolidated underlying revenue of $14,382 million differs from Consolidated sales and other income of $14,552 million as a result of the gain on sale of Qantas Holidays ($86 million) and the
revenue from direct earn conversion ($84 million). Both of these items are reported in the Consolidated Income Statement as other revenue.
2. Of the net change in accounting estimates of $164 million in relation to frequent yer accounting as described in Note 1(C), EBITDAR includes $80 million (Qantas Frequent Flyer $63 million
and Eliminations $17 million) representing the six month impact of the change in accounting estimate.
2. Underlying PBT and Operating Segments continued