Qantas 2010 Annual Report Download - page 19
Download and view the complete annual report
Please find page 19 of the 2010 Qantas annual report below. You can navigate through the pages in the report by either clicking on the pages listed below, or by using the keyword search tool below to find specific information within the annual report.-
 1
1 -
2
-
3
-
4
-
5
-
6
-
7
-
8
-
 9
9 -
 10
10 -
 11
11 -
 12
12 -
 13
13 -
 14
14 -
 15
15 -
 16
16 -
 17
17 -
 18
18 -
 19
19 -
 20
20 -
 21
21 -
 22
22 -
 23
23 -
 24
24 -
 25
25 -
 26
26 -
 27
27 -
 28
28 -
 29
29 -
30
-
31
-
32
-
33
-
34
-
35
-
36
-
37
-
38
-
39
-
40
-
41
-
42
-
43
-
44
-
45
-
46
-
47
-
48
-
49
-
50
-
51
-
52
-
53
-
54
-
55
-
56
-
57
-
58
-
59
-
60
-
61
-
62
-
63
-
64
-
65
-
66
-
67
-
68
-
69
-
70
-
71
-
72
-
73
-
74
-
75
-
76
-
77
-
78
-
79
-
80
-
81
-
82
-
83
-
84
-
85
-
86
-
87
-
88
-
89
-
90
-
91
-
92
-
93
-
94
-
95
-
96
-
97
-
98
-
99
-
100
-
101
-
102
-
103
-
104
-
105
-
106
-
107
-
108
-
109
-
110
-
111
-
112
-
113
-
114
-
115
-
116
-
117
-
118
-
119
-
120
 |
 |
17 ANNUAL REPORT 2010
for the year ended 30 June 2010
Review of Operations continued
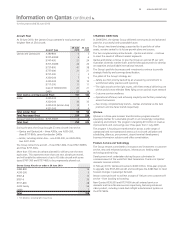
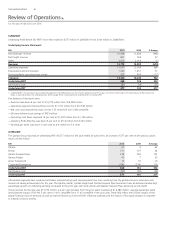
Operating expenses for the year were $11,577 million, an improvement of 8 per cent from the prior year’s operating expenses of $12,545 million.
Unit costs improved by 8 per cent to 8.07 cents/ASK from 8.80 cents/ASK in the prior year. These improvements were attributable to substantial
reductions in fuel and manpower costs, and savings of $533 million for the year from the QFuture program. Fuel into-plane prices were 13 per cent
lower than 2008/2009. Excluding fuel and one-off items, net underlying unit costs were 5.55 cents/ASK, an improvement of 4 per cent on the
previous year’s result of 5.80 cents/ASK.
2010 2009 % change
Available Seat Kilometres (ASKs)1M 124,717 124,594 0.1
Revenue Passenger Kilometres (RPKs)2M 100,727 99,176 1.6
Passenger Numbers ’000 41,428 38,438 7.8
Seat Factor % 80.8 79.6 1.2 pts
Yield (excluding FX) c/RPK 10.61 11.43 (7.2)
Net Underlying unit cost3c/ASK 5.55 5.80 4.3
1. ASK – total number of seats available for passengers, multiplied by the number of kilometres own.
2. RPK – total number of paying passengers carried, multiplied by the number of kilometres own.
3. Net Underlying unit cost – Net expenditure excluding fuel and one-off items per ASK.
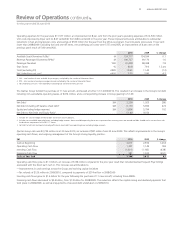
The Qantas Group funded the purchase of 11 new aircraft, and leased a further 12 in 2009/2010. This resulted in an increase in the Group’s net debt
including non-cancellable operating leases, of $474 million, and a corresponding increase in Group gearing to 51:49.
2010 2009 $ change
Net Debt1$M 2,209 1,923 286
Net Debt including off balance sheet debt2$M 6,170 5,696 474
Equity (excluding hedge reserves) $M 5,896 5,794 102
Net Debt to Net Debt and Equity Ratio351:49 50:50
1. Includes fair value of hedges related to debt and aircraft security deposits.
2. Includes non-cancellable operating leases, excluding hedge reserves. Non-cancellable operating leases are a representation assuming assets are owned and debt funded and is not consistent with
the disclosure requirements of AASB 117: Leases.
3. Net Debt to Net Debt and Equity (including off balance sheet debt from operating leases excluding hedge reserves).
Qantas Group cash was $3,704 million as at 30 June 2010, an increase of $87 million from 30 June 2009. This re ects improvements in the Group’s
operating cash ows, and ongoing management of the Group’s strong liquidity position.
$M 2010 2009 $ change
Cash at Beginning 3,617 2,599 1,018
Operating Cash Flow 1,307 1,149 158
Investing Cash Flow (1,601) (1,163) (438)
Financing Cash Flow 381 1,032 (651)
Cash at Year End 3,704 3,617 87
Operating cash ow grew to $1.3 billion, an increase of $158 million compared to the prior year result that included Qantas Frequent Flyer billings
associated with the direct earn rush in. This increase was attributable to:
—Improvements in cash earnings across the Group and working capital initiatives
—Tax refunds of $129 million in 2009/2010, compared to payments of $274 million in 2008/2009
Investing cash ows grew to $1.6 billion for the year following the purchase of 11 new aircraft, including three A380s.
Financing cash ows decreased to $0.4 billion, from $1.0 billion for 2008/2009. The reduction re ects the capital raising and dividend payments that
took place in 2008/2009, as well as prepayments of secured debt undertaken in 2009/2010.