Qantas 2010 Annual Report Download - page 111
Download and view the complete annual report
Please find page 111 of the 2010 Qantas annual report below. You can navigate through the pages in the report by either clicking on the pages listed below, or by using the keyword search tool below to find specific information within the annual report.-
 1
1 -
2
-
3
-
4
-
5
-
6
-
7
-
8
-
9
-
10
-
11
-
12
-
13
-
14
-
15
-
16
-
17
-
18
-
19
-
20
-
21
-
22
-
23
-
24
-
25
-
26
-
27
-
28
-
29
-
30
-
31
-
32
-
33
-
34
-
35
-
36
-
37
-
38
-
39
-
40
-
41
-
42
-
43
-
44
-
45
-
46
-
47
-
48
-
49
-
50
-
51
-
52
-
53
-
54
-
55
-
56
-
57
-
58
-
59
-
60
-
61
-
62
-
63
-
64
-
65
-
66
-
67
-
68
-
69
-
70
-
71
-
72
-
73
-
74
-
75
-
76
-
77
-
78
-
79
-
80
-
81
-
82
-
83
-
84
-
85
-
86
-
87
-
88
-
89
-
90
-
91
-
92
-
93
-
94
-
95
-
96
-
97
-
98
-
99
-
100
-
 101
101 -
 102
102 -
 103
103 -
 104
104 -
 105
105 -
 106
106 -
 107
107 -
 108
108 -
 109
109 -
 110
110 -
 111
111 -
 112
112 -
 113
113 -
 114
114 -
 115
115 -
 116
116 -
 117
117 -
 118
118 -
 119
119 -
 120
120
 |
 |

109 ANNUAL REPORT 2010
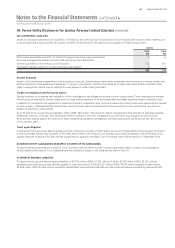
Sustainability Statistics and Notes continued
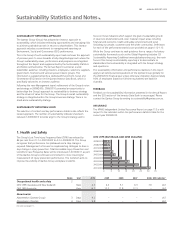
The Group is committed to providing our employees with exible
workplace arrangements including part-time work opportunities.
The Group also provides a range of bene ts and well-being initiatives
(outlined on page 44 of the Annual Review). Workplace exibility
is an important driver of staff engagement and retention. The
percentage of Qantas Group employees who work part-time has
increased from 12.4 per cent in 2005/2006 to 13.1 per cent in
2009/2010.
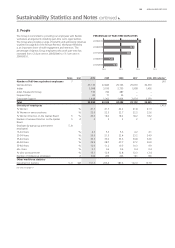
PERCENTAGE OF PART-TIME EMPLOYEES
3. People
Notes Unit 2010 2009 2008 2007 2006 GRI indicator1
Number of full time equivalent employees 7 LA1
Qantas Airlines 27,132 27,845 29,196 29,070 30,370
Jetstar 3,098 3,010 2,735 1,958 1,405
Jetset Travelworld Group 730 742 487 – –
Frequent Flyer 82 71 53 – –
Corporate Support 1,448 1,362 1,824 2,074 2,250
Total 32,490 33,030 34,295 33,102 34,025
Diversity of employees LA13
% Women % 41.7 41.7 42.2 41.8 41.3
% Women in senior positions % 22.6 22.3 22.7 22.5 22.6
% Women Directors on the Qantas Board 5 % 20.0 18.2 18.2 18.2 18.2
Number of women Directors on the Qantas
Board
5#22222
Employee by age group (permanent
employees)
5, 8
16-24 Years % 4.5 5.3 5.6 4.2 4.1
25-34 Years % 20.6 21.3 22.4 23.2 24.9
35-44 Years % 32.3 33.0 33.6 34.8 34.6
45-54 Years % 29.9 28.7 27.7 27.2 26.0
55-64 Years % 12.0 11.2 10.3 10.3 9.9
65+ Years % 0.7 0.6 0.4 0.4 0.4
% who work part-time % 13.1 12.9 12.8 12.3 12.4
Number of Indigenous employees # 304 269 203 141 136
Other workforce statistics
Investment in training 5, 9 $M 151.7 206.4 187.6 122.0 137.9
For notes see page 111.
12.0 12.5 13.0 13.5
2009/2010
2008/2009
2007/2008
2006/2007
2005/2006
13.1
12.9
12.8
12.3
12.4