Qantas 2010 Annual Report Download - page 70
Download and view the complete annual report
Please find page 70 of the 2010 Qantas annual report below. You can navigate through the pages in the report by either clicking on the pages listed below, or by using the keyword search tool below to find specific information within the annual report.-
 1
1 -
2
-
3
-
4
-
5
-
6
-
7
-
8
-
9
-
10
-
11
-
12
-
13
-
14
-
15
-
16
-
17
-
18
-
19
-
20
-
21
-
22
-
23
-
24
-
25
-
26
-
27
-
28
-
29
-
30
-
31
-
32
-
33
-
34
-
35
-
36
-
37
-
38
-
39
-
40
-
41
-
42
-
43
-
44
-
45
-
46
-
47
-
48
-
49
-
50
-
51
-
52
-
53
-
54
-
55
-
56
-
57
-
58
-
59
-
 60
60 -
 61
61 -
 62
62 -
 63
63 -
 64
64 -
 65
65 -
 66
66 -
 67
67 -
 68
68 -
 69
69 -
 70
70 -
 71
71 -
 72
72 -
 73
73 -
 74
74 -
 75
75 -
 76
76 -
 77
77 -
 78
78 -
 79
79 -
 80
80 -
81
-
82
-
83
-
84
-
85
-
86
-
87
-
88
-
89
-
90
-
91
-
92
-
93
-
94
-
95
-
96
-
97
-
98
-
99
-
100
-
101
-
102
-
103
-
104
-
105
-
106
-
107
-
108
-
109
-
110
-
111
-
112
-
113
-
114
-
115
-
116
-
117
-
118
-
119
-
120
 |
 |

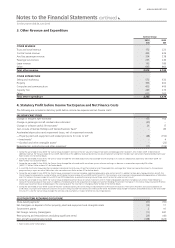
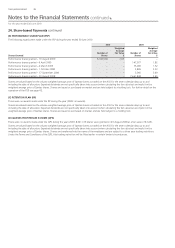
THE QANTAS GROUP 68
for the year ended 30 June 2010
Notes to the Financial Statements continued
Qantas Group
2010
$M
2009
$M
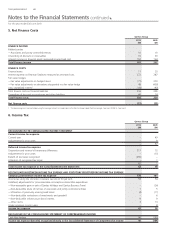
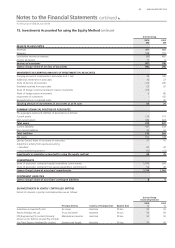
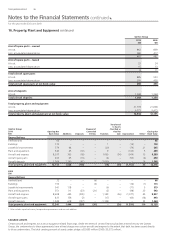
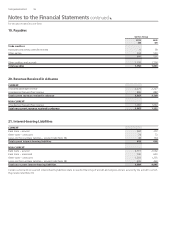
RESULTS OF JOINTLY CONTROLLED ENTITIES
Revenues 1,245 1,318
Expenses 1,212 1,297
Pro t before income tax expense 33 21
Income tax expense (13) (1)
Net pro t of jointly controlled entities 20 20
Qantas Group’s share of net pro t of jointly controlled entities 10 10
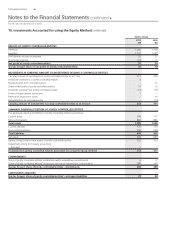
MOVEMENTS IN CARRYING AMOUNT OF INVESTMENTS IN JOINTLY CONTROLLED ENTITIES
Carrying amount of investments in jointly controlled entities as at 1 July 311 295
Additional investment in jointly controlled entities 4–
Reclassi cation from controlled entity –21
Share of net pro t of jointly controlled entities 10 10
Dividends received from jointly controlled entities (13) (15)
Share of hedge reserve movement 1–
Reversal of impairment losses –19
Reclassi cation to controlled entity – (19)
Carrying amount of investments in jointly controlled entities as at 30 June 313 311
SUMMARY FINANCIAL POSITION OF JOINTLY CONTROLLED ENTITIES
The aggregate assets and liabilities of jointly controlled entities is as follows:
Current assets 208 177
Non-current assets 887 881
Total assets 1,095 1,058
Current liabilities 170 133
Non-current liabilities 300 304
Total liabilities 470 438
Net assets 625 620
Qantas Group’s share of net assets of jointly controlled entities 312 310
Adjustment arising from equity accounting
—Goodwill 11
Investments in jointly controlled entities accounted for using the equity method 313 311
COMMITMENTS
Share of jointly controlled entities’ contracted capital expenditure commitments 4 12
Share of jointly controlled entities’ contracted non-capital expenditure commitments 388 357
Qantas Group’s share of jointly controlled entities’ commitments 392 369
CONTINGENT LIABILITIES
Qantas Group’s share of jointly controlled entities’ contingent liabilities 31 33
15. Investments Accounted for using the Equity Method continued