Qantas 2010 Annual Report Download - page 115
Download and view the complete annual report
Please find page 115 of the 2010 Qantas annual report below. You can navigate through the pages in the report by either clicking on the pages listed below, or by using the keyword search tool below to find specific information within the annual report.-
 1
1 -
2
-
3
-
4
-
5
-
6
-
7
-
8
-
9
-
10
-
11
-
12
-
13
-
14
-
15
-
16
-
17
-
18
-
19
-
20
-
21
-
22
-
23
-
24
-
25
-
26
-
27
-
28
-
29
-
30
-
31
-
32
-
33
-
34
-
35
-
36
-
37
-
38
-
39
-
40
-
41
-
42
-
43
-
44
-
45
-
46
-
47
-
48
-
49
-
50
-
51
-
52
-
53
-
54
-
55
-
56
-
57
-
58
-
59
-
60
-
61
-
62
-
63
-
64
-
65
-
66
-
67
-
68
-
69
-
70
-
71
-
72
-
73
-
74
-
75
-
76
-
77
-
78
-
79
-
80
-
81
-
82
-
83
-
84
-
85
-
86
-
87
-
88
-
89
-
90
-
91
-
92
-
93
-
94
-
95
-
96
-
97
-
98
-
99
-
100
-
101
-
102
-
103
-
104
-
 105
105 -
 106
106 -
 107
107 -
 108
108 -
 109
109 -
 110
110 -
 111
111 -
 112
112 -
 113
113 -
 114
114 -
 115
115 -
 116
116 -
 117
117 -
 118
118 -
 119
119 -
 120
120
 |
 |

113 ANNUAL REPORT 2010
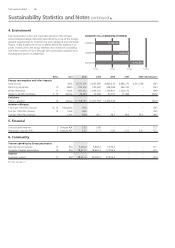
Water (Australia)
The total amount of water consumed as measured in KL (kilolitres) by
Qantas Group sites within Australia where water is separately metered
and billed for the period 1 July to 30 June.
Waste to land ll (Australia)
Total solid waste and quarantine waste generated as measured in tonnes
by Qantas Group sites (including Engineering, Airports, Catering and
Corporate Support) within Australia where Qantas is responsible for the
waste removal and is separately billed (that is, where there is a separately
identi ed item on a bill for waste and is not part of a general overhead
charge) for the period 1 July to 30 June.
Carbon dioxide equivalent (CO2-e) – aviation
The amount of greenhouse gas emissions measured in carbon dioxide
equivalent (CO2-e) tonnes generated from aviation fuel consumption
(as de ned above) from 1 July to 30 June. Under the Australian
Government’s Department of Climate Change National Greenhouse
Accounts (NGA) Factors, emissions incorporated into the calculation
include carbon dioxide (CO2), methane (CH4) and nitrous oxide (N2O).
Qantas applies the NGA Factors conversions and methodology for the
calculation of CO2-e.
Carbon dioxide equivalent (CO2-e) per 100 Revenue Tonne
Kilometres (RTKs) (Group)
A measure of carbon dioxide equivalent (CO2-e) emissions ef ciency
based on CO2-e production per 100 RTKs for Qantas Group from 1 July
to 30 June. CO2-e emissions for aviation as de ned above. This measure
has been expanded to include Jetstar and QantasLink in 2010.
Fuel per 100 Revenue Tonne Kilometres (RTKs) (Group)
A measure of ef ciency based on fuel consumption per 100 RTKs for
Qantas Group from 1 July to 30 June. This measure has been expanded
to include Jetstar and QantasLink in 2010.
FINANCIAL
Unit cost performance
Unit cost performance refers to the net underlying unit cost of the
Group, which is the net expenditure, excluding aviation fuel and
non-recurring items, divided by Available Seat Kilometres (ASKs)
multiplied by 100. The net expenditure is passenger revenue minus
Underlying pro t before tax.
Manpower cost per Available Seat Kilometre (ASK)
Manpower cost relates to ongoing payroll costs including salaries and
wages paid to employees and contractors, allowances, shift penalties,
overtime paid, bonuses and on-costs including employee leave
entitlements, payroll tax, superannuation contributions and workers’
compensation premiums. Employee redundancy cost is excluded due to
its one-off nature.
Available Seat Kilometres (ASKs)
ASKs refer to the total number of seats available for passengers
multiplied by the number of kilometres own and is a measure
of airline capacity.
COMMUNITY
Tourism spending by Qantas Group passengers
This measure comprises the Qantas Group’s contribution to national export
revenue and domestic traveller expenditure.
National export revenue
National export revenue is calculated by the number of inbound visitors
brought to Australia by Qantas and Jetstar for the 12 months to 31 May
2010 (latest available data) multiplied by the assumed visitor expenditure
(based on the average expenditure per visitor according to Tourism
Australia’s March 2010 International Visitor Survey (latest available data)).
This amount does not include the value of airfare and freight charges
that accrue to Qantas from overseas sources which also represent export
revenue.
Domestic traveller expenditure
Domestic traveller expenditure is calculated as the number of Qantas
Group domestic passengers for the 12 months to 31 May 2010
multiplied by the average expenditure per overnight visitor according to
Tourism Australia’s March 2010 National Visitor Survey (latest available
data). This amount includes the value of related airfares. As it is not
possible to disaggregate the data, the calculation should be viewed as
indicative only e.g. the gure may include some international visitor
expenditure (where domestic ights are purchased after arrival in
Australia) or understate the expenditure associated with domestic ights
which are “round trip”.
Indirect economic output
This indirect economic output measure comprises Qantas Group revenue
multiplied by a Qantas Group economic multiplier of 2.1 (as calculated
by Access Economics).
The multiplier is derived from Australian Bureau of Statistics input-output
tables of the Australian economy. Access Economics is an economic
advisory company which provides expertise in analysis, modelling and
forecasting. Access Economics was commissioned by Qantas to gain
a better understanding of the Group’s contribution to the Australian
economy. A multiplier of 2.1 suggests that a $1 million increase in
demand for Qantas’ services leads to a $2.1 million increase in output
from all sectors in the economy, including air transportation. In other
words, the ow-on effects to other sectors is $1.1 million.
Sustainability Statistics De nitions continued
Sustainability Statistics and Notes continued