Qantas 2010 Annual Report Download - page 45
Download and view the complete annual report
Please find page 45 of the 2010 Qantas annual report below. You can navigate through the pages in the report by either clicking on the pages listed below, or by using the keyword search tool below to find specific information within the annual report.-
 1
1 -
2
-
3
-
4
-
5
-
6
-
7
-
8
-
9
-
10
-
11
-
12
-
13
-
14
-
15
-
16
-
17
-
18
-
19
-
20
-
21
-
22
-
23
-
24
-
25
-
26
-
27
-
28
-
29
-
30
-
31
-
32
-
33
-
34
-
 35
35 -
 36
36 -
 37
37 -
 38
38 -
 39
39 -
 40
40 -
 41
41 -
 42
42 -
 43
43 -
 44
44 -
 45
45 -
 46
46 -
 47
47 -
 48
48 -
 49
49 -
 50
50 -
 51
51 -
 52
52 -
 53
53 -
 54
54 -
 55
55 -
56
-
57
-
58
-
59
-
60
-
61
-
62
-
63
-
64
-
65
-
66
-
67
-
68
-
69
-
70
-
71
-
72
-
73
-
74
-
75
-
76
-
77
-
78
-
79
-
80
-
81
-
82
-
83
-
84
-
85
-
86
-
87
-
88
-
89
-
90
-
91
-
92
-
93
-
94
-
95
-
96
-
97
-
98
-
99
-
100
-
101
-
102
-
103
-
104
-
105
-
106
-
107
-
108
-
109
-
110
-
111
-
112
-
113
-
114
-
115
-
116
-
117
-
118
-
119
-
120
 |
 |

43 ANNUAL REPORT 2010
for the year ended 30 June 2010
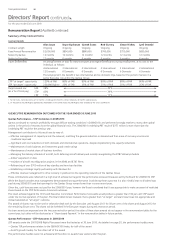
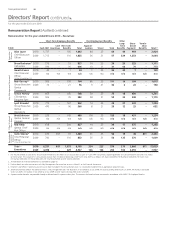
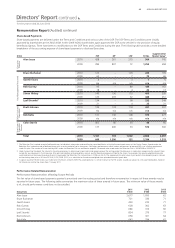
Share-based Payments
Share-based payments are delivered under the Terms and Conditions and various rules of the DSP. The DSP Terms and Conditions were initially
approved by shareholders at the 2002 AGM. At the 2006 AGM, shareholders again approved the DSP as the vehicle for the provision of equity
bene ts by Qantas. There have been no modi cations to the DSP Terms and Conditions during the year. The following table provides a more detailed
breakdown of the accounting expense of share-based payments to disclosed Executives.
$’000 PSP RP1LTIP TOTAL
Supplemental
Market Value2
Executive
Director
Alan Joyce 2010 428 261 275 964 742
2009 284 897 72 1,253 658
Key Management Personnel
Bruce Buchanan 2010 122 – 103 225 199
2009 63 – 7 70 66
Gareth Evans 2010 4 – 3 7 6
2009 n/a n/a n/a n/a n/a
Rob Gurney 2010 95 – 89 184 163
2009 18 – 4 22 13
Simon Hickey 2010 149 136 115 400 299
2009 123 293 32 448 251
Lyell Strambi32010 134 – 98 232 248
2009 21 – 4 25 31
Other Disclosed
Executives
Brett Johnson 2010 139 174 118 431 297
2009 n/a n/a n/a n/a n/a
Rob Kella 2010 131 136 108 375 277
2009 n/a n/a n/a n/a n/a
Terminated
Executive
Director
Colin Storrie 2010 (41) (4) 93 48 66
2009 137 406 33 576 300
Total 2010 1,161 703 1,002 2,866 2,297
2009 646 1,596 152 2,394 1,319
1. The Retention Plan involved awards of deferred shares to individuals whose roles and contribution were identi ed as critical to the continued success of the Qantas Group. Awards under the
Retention Plan involved awards of deferred shares with a service period of up to three years. Satisfactory performance, which involves achievement of personal KPIs was a further requirement
under this plan. The number of shares held by KMPs under the Retention Plan are outlined on page 88. No awards were made under the Retention Plan in 2008/2009 or 2009/2010.
2. Under Accounting Standards, the value of a share-based payment is determined at grant date and recognised over the vesting period. No allowance is made when recognising the value of these
awards for any movement in the share price after grant date before vesting conditions are met and the Executive becomes entitled to the shares. For example, the volume weighted share price
used to determine the accounting value of grants issued under the Retention Plan to Executives in 2008 was $5.45. The supplemental market value at year end of share-based payments is based
on the closing share price at 30 June 2010 of $2.20 (2009: $2.01) as a substitute for the volume weighted share price determined at grant date.
3. A sign-on award of 75,000 shares was made to Mr Strambi on 4 March 2009. The award operates in a similar manner to the PSP awards. Awards are subject to a ten-year holding lock, however
Mr Strambi can call for the shares from 1 January 2011.
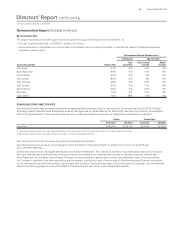
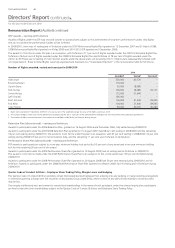
Performance Related Remuneration
Performance Remuneration affecting Future Periods
The fair value of share-based payments granted is amortised over the vesting period and therefore remuneration in respect of these awards may be
reported in future years. The following table summarises the maximum value of these awards in future years. The minimum value of these awards
is nil, should performance conditions not be satis ed.
Executives
2011
$’000
2012
$’000
2013
$’000
Alan Joyce 2,677 1,050 62
Bruce Buchanan 721 336 71
Gareth Evans 493 233 71
Rob Gurney 628 302 63
Simon Hickey 686 316 66
Lyell Strambi 834 379 77
Brett Johnson 658 301 64
Rob Kella 643 294 62
Remuneration Report (Audited) continued
Directors’ Report continued