Qantas 2010 Annual Report Download - page 39
Download and view the complete annual report
Please find page 39 of the 2010 Qantas annual report below. You can navigate through the pages in the report by either clicking on the pages listed below, or by using the keyword search tool below to find specific information within the annual report.-
 1
1 -
2
-
3
-
4
-
5
-
6
-
7
-
8
-
9
-
10
-
11
-
12
-
13
-
14
-
15
-
16
-
17
-
18
-
19
-
20
-
21
-
22
-
23
-
24
-
25
-
26
-
27
-
28
-
 29
29 -
 30
30 -
 31
31 -
 32
32 -
 33
33 -
 34
34 -
 35
35 -
 36
36 -
 37
37 -
 38
38 -
 39
39 -
 40
40 -
 41
41 -
 42
42 -
 43
43 -
 44
44 -
 45
45 -
 46
46 -
 47
47 -
 48
48 -
 49
49 -
50
-
51
-
52
-
53
-
54
-
55
-
56
-
57
-
58
-
59
-
60
-
61
-
62
-
63
-
64
-
65
-
66
-
67
-
68
-
69
-
70
-
71
-
72
-
73
-
74
-
75
-
76
-
77
-
78
-
79
-
80
-
81
-
82
-
83
-
84
-
85
-
86
-
87
-
88
-
89
-
90
-
91
-
92
-
93
-
94
-
95
-
96
-
97
-
98
-
99
-
100
-
101
-
102
-
103
-
104
-
105
-
106
-
107
-
108
-
109
-
110
-
111
-
112
-
113
-
114
-
115
-
116
-
117
-
118
-
119
-
120
 |
 |

37 ANNUAL REPORT 2010
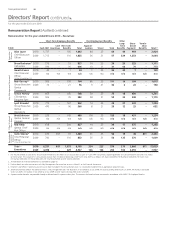
for the year ended 30 June 2010
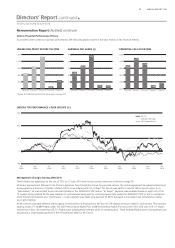
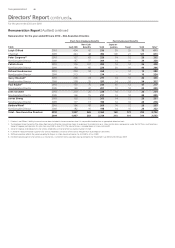
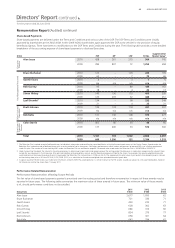
Qantas Financial Performance History
To provide further context on Qantas’ performance, the following graphs outline a ve year history of key nancial metrics.
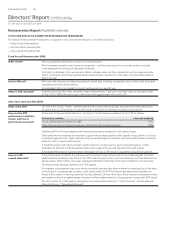
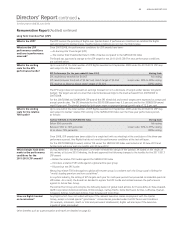
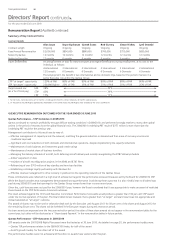
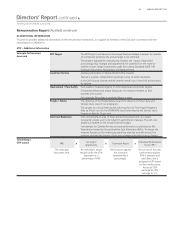
Remuneration Report (Audited) continued
Directors’ Report continued
2005/2006* 2006/2007* 2007/2008* 2008/2009 2009/2010
0
300
600
900
1
,200
1
,500
671
100
377
965
1,408
2005/2006 2006/2007 2007/2008 2008/2009 2009/2010
1,000
1,300
1,600
1,900
2,200
2,500
2,026
1,149
1,307
2,353
2,128
Jul
2005
Jan
2006
Jul
2006
Jan
2007
Jul
2007
Jan
2008
Qantas
ASX/S&P 100 Index
MSCI World Airlines
Jul
2008
Jan
2009
Jul
2009
Jun
2010
Jan
2010
-50
0
50
100
150
2005/2006 2006/2007 2007/2008 2008/2009 2009/2010
0
10
20
30
40
50
24.9
5.6 4.9
34.0
49.0
UNDERLYING PROFIT BEFORE TAX ($M) OPERATING CASH FLOW ($M)
QANTAS TSR PERFORMANCE v PEER GROUPS (%)
EARNINGS PER SHARE (¢)
* Figures for 2005/2006 to 2007/2008 are based on Statutory PBT.
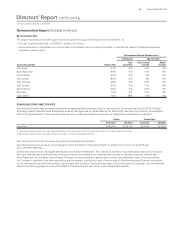
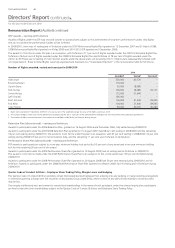
Management Changes During 2009/2010
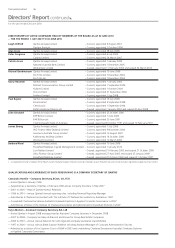
Gareth Evans was appointed to the role of CFO on 15 June 2010 and his key contract terms are outlined on page 36.
Mr Evans’ appointment followed Colin Storrie’s departure from the Qantas Group for personal reasons. By mutual agreement he ceased employment
and resigned as a Director of Qantas in March 2010. In accordance with his contract, Mr Storrie was paid 9.5 months FAR in lieu of notice. As a
“good leaver” he was entitled to pro-rata participation in the 2009/2010 STIP and an “at target” payment was awarded based on eight out of the
12 months being worked for the year. Despite no cash bonuses being paid to continuing executives under the 2009/2010 STIP, in the circumstances
of Mr Storrie’s termination as a “good leaver”, a cash payment was made. The payment of $697 thousand is disclosed in the remuneration tables
as a Cash Incentive.
All Mr Storrie’s unvested deferred shares lapsed on termination of employment. Mr Storrie’s LTIP awards were pro-rated for time served. This involved
lapsing a total of 114,889 Rights under the 2007 Performance Rights Plan, 2008 Performance Rights Plan and 2010-2012 LTIP, with 109,111 Rights
remaining on-foot. All remaining 109,111 Rights were subsequently forfeited (with nil compensation). These forfeited Rights were fully expensed and
disclosed as a Share-based payment in the remuneration table for Mr Storrie.