Qantas 2010 Annual Report Download - page 100
Download and view the complete annual report
Please find page 100 of the 2010 Qantas annual report below. You can navigate through the pages in the report by either clicking on the pages listed below, or by using the keyword search tool below to find specific information within the annual report.-
 1
1 -
2
-
3
-
4
-
5
-
6
-
7
-
8
-
9
-
10
-
11
-
12
-
13
-
14
-
15
-
16
-
17
-
18
-
19
-
20
-
21
-
22
-
23
-
24
-
25
-
26
-
27
-
28
-
29
-
30
-
31
-
32
-
33
-
34
-
35
-
36
-
37
-
38
-
39
-
40
-
41
-
42
-
43
-
44
-
45
-
46
-
47
-
48
-
49
-
50
-
51
-
52
-
53
-
54
-
55
-
56
-
57
-
58
-
59
-
60
-
61
-
62
-
63
-
64
-
65
-
66
-
67
-
68
-
69
-
70
-
71
-
72
-
73
-
74
-
75
-
76
-
77
-
78
-
79
-
80
-
81
-
82
-
83
-
84
-
85
-
86
-
87
-
88
-
89
-
 90
90 -
 91
91 -
 92
92 -
 93
93 -
 94
94 -
 95
95 -
 96
96 -
 97
97 -
 98
98 -
 99
99 -
 100
100 -
 101
101 -
 102
102 -
 103
103 -
 104
104 -
 105
105 -
 106
106 -
 107
107 -
 108
108 -
 109
109 -
 110
110 -
111
-
112
-
113
-
114
-
115
-
116
-
117
-
118
-
119
-
120
 |
 |
THE QANTAS GROUP 98
for the year ended 30 June 2010
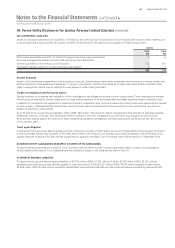
Notes to the Financial Statements continued
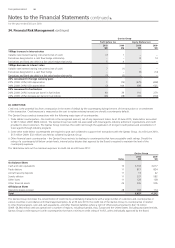
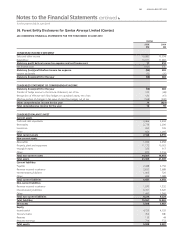
Qantas Group
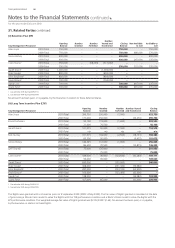
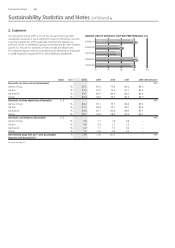
Pro t before tax Equity (Before tax)
2010
$M
2009
$M
2010
$M
2009
$M
100bps increase in interest rates
Variable rate interest bearing instruments (net of cash) (7) 1 – –
Derivatives designated in a cash ow hedge relationship – – 8 14
Derivatives and xed rate debt in a fair value hedge relationship 5 4 – –
100bps decrease in interest rates
Variable rate interest bearing instruments (net of cash) 7 (1) – –
Derivatives designated in a cash ow hedge – – (9) (14)
Derivatives and xed rate debt in a fair value hedge relationship (5) (5) – –
20% movement in foreign currency pairs
20% (2009: 20%) USD depreciation 1 (76) (479) (458)
20% (2009: 20%) USD appreciation (2) 104 938 625
20% movement in fuel indices
20% (2009: 20%) increase per barrel in fuel indices 60 39 110 279
20% (2009: 20%) decrease per barrel in fuel indices (26) (28) (89) (204)
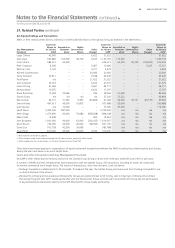
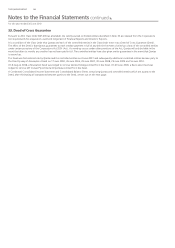
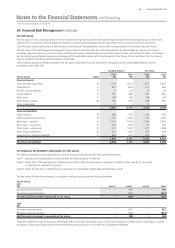
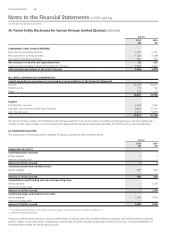
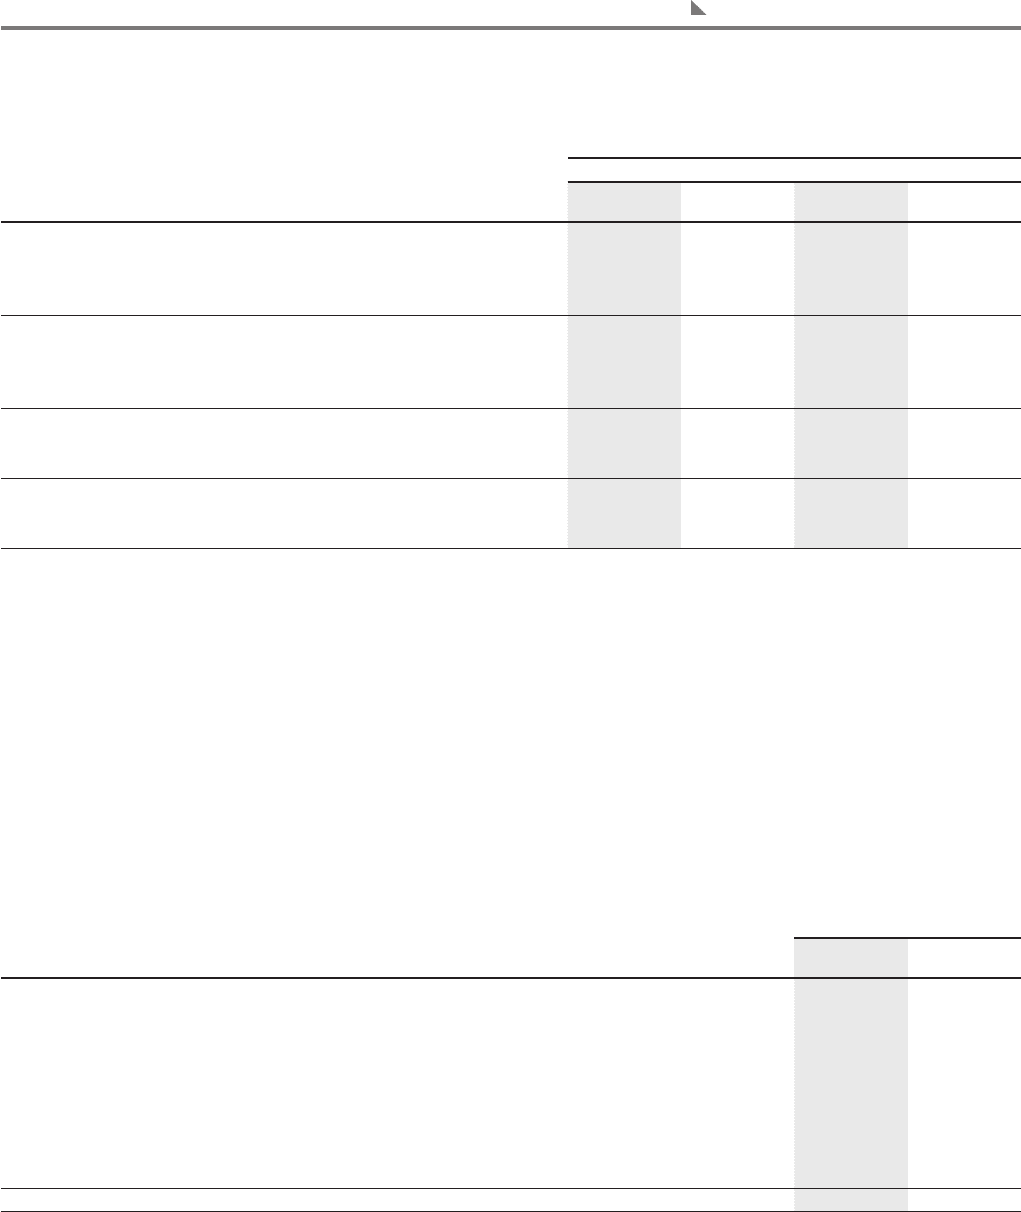
(C) CREDIT RISK
Credit risk is the potential loss from a transaction in the event of default by the counterparty during the term of the transaction or on settlement
of the transaction. Credit exposure is measured as the cost to replace existing transactions should a counterparty default.
The Qantas Group conducts transactions with the following major types of counterparties:
i. Trade debtor counterparties – the credit risk is the recognised amount, net of any impairment losses. As at 30 June 2010, trade debtor amounted
to $817 million (2009: $824 million). The Qantas Group has credit risk associated with travel agents, industry settlement organisations and credit
provided to direct customers. The Qantas Group minimises this credit risk through the application of stringent credit policies and accreditation of
travel agents through industry programs
ii. Some other trade debtor counterparties are required to post cash collateral to support their transactions with the Qantas Group. As at 30 June 2010,
$13 million (2009: $32 million) was held as collateral by Qantas Group
iii. Other nancial asset counterparties – the Qantas Group restricts its dealings to counterparties that have acceptable credit ratings. Should the
rating of a counterparty fall below certain levels, internal policy dictates that approval by the Board is required to maintain the level of the
counterparty exposure
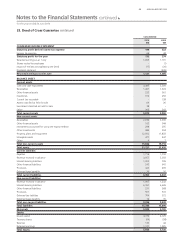
The table below sets out the maximum exposure to credit risk as at 30 June 2010:
Qantas Group
Notes
2010
$M
2009
$M
On Balance Sheet
Cash and cash equivalents 10 3,704 3,617
Trade debtors 11 817 824
Aircraft security deposits 11 13 42
Sundry debtors 11 537 582
Other loans 11 128 128
Other nancial assets 25 335 905
Off Balance Sheet
Operating leases as lessor 28 103 114
Total 5,637 6,212
The Qantas Group minimises the concentration of credit risk by undertaking transactions with a large number of customers and counterparties in
various countries in accordance with Board approved policy. As at 30 June 2010, the credit risk of the Qantas Group to counterparties in relation
to other nancial assets, cash and cash equivalents, and other nancial liabilities where a right of offset exists amounted to $4,114 million
(2009: $4,364 million) and was spread over a number of regions, including Australia, Asia, Europe and the United States. Excluding associated entities,
Qantas Group’s credit exposure is with counterparties that have a minimum credit rating of A-/A3, unless individually approved by the Board.
34. Financial Risk Management continued