Qantas 2010 Annual Report Download - page 74
Download and view the complete annual report
Please find page 74 of the 2010 Qantas annual report below. You can navigate through the pages in the report by either clicking on the pages listed below, or by using the keyword search tool below to find specific information within the annual report.-
 1
1 -
2
-
3
-
4
-
5
-
6
-
7
-
8
-
9
-
10
-
11
-
12
-
13
-
14
-
15
-
16
-
17
-
18
-
19
-
20
-
21
-
22
-
23
-
24
-
25
-
26
-
27
-
28
-
29
-
30
-
31
-
32
-
33
-
34
-
35
-
36
-
37
-
38
-
39
-
40
-
41
-
42
-
43
-
44
-
45
-
46
-
47
-
48
-
49
-
50
-
51
-
52
-
53
-
54
-
55
-
56
-
57
-
58
-
59
-
60
-
61
-
62
-
63
-
 64
64 -
 65
65 -
 66
66 -
 67
67 -
 68
68 -
 69
69 -
 70
70 -
 71
71 -
 72
72 -
 73
73 -
 74
74 -
 75
75 -
 76
76 -
 77
77 -
 78
78 -
 79
79 -
 80
80 -
 81
81 -
 82
82 -
 83
83 -
 84
84 -
85
-
86
-
87
-
88
-
89
-
90
-
91
-
92
-
93
-
94
-
95
-
96
-
97
-
98
-
99
-
100
-
101
-
102
-
103
-
104
-
105
-
106
-
107
-
108
-
109
-
110
-
111
-
112
-
113
-
114
-
115
-
116
-
117
-
118
-
119
-
120
 |
 |
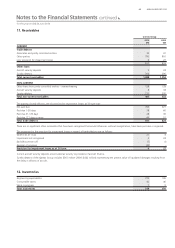
THE QANTAS GROUP 72
for the year ended 30 June 2010
Notes to the Financial Statements continued
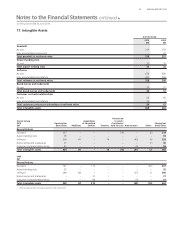
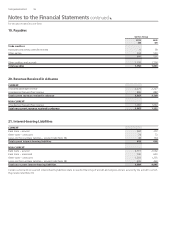
IMPAIRMENT TESTS FOR CASH GENERATING UNITS (CGUS) CONTAINING GOODWILL AND OTHER INTANGIBLE ASSETS
WITH INDEFINITE USEFUL LIVES
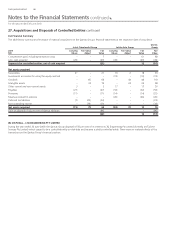
The following CGUs have goodwill and other intangible assets with inde nite useful lives:
Qantas Group
2010
$M
2009
$M
Goodwill
Qantas123 39
Jetstar 130 132
Jetset Travelworld Group 66 66
219 237
Airport landing slots
Qantas 35 35
35 35
Brand names and trademarks
Jetstar 21 22
Jetset Travelworld Group 99
30 31
1. The Qantas CGU includes Qantas, Qantas Freight and Qantas Frequent Flyer. As all of these businesses are largely dependent on the Qantas Fleet to generate their revenue, the Qantas Fleet assets
are tested at the Qantas CGU level including the cash ows and assets of these segments.
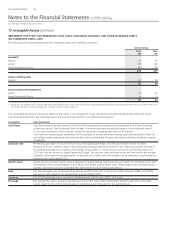
The recoverable amounts of CGUs were based on their value in use calculations. Those calculations were determined by discounting the future
cash ows generated from the continuing use of the units and were based on the following assumptions:
Assumption How determined
Cash ows Cash ows were projected based on the Financial Plan approved by management and endorsed by the Board covering
a three-year period. Cash ows after the third year or terminal year were extrapolated using a constant growth rate of
2.5 per cent per annum, which does not exceed the long-term average growth rate for the industry.
Cash out ows include capital expenditure for the purchase of aircraft and other property, plant and equipment. These do
not include capital expenditure that enhances the current performance of assets and related cash ows have been treated
consistently.
Discount rate Pre-tax discount rates of 10.5 per cent per annum for Qantas and Jetstar and 16.0 per cent per annum for Jetset
Travelworld Group have been used in discounting the projected cash ows of these CGUs, re ecting a market estimate of
the weighted average cost of capital of the Qantas Group (2009: 11.23 per cent per annum for Qantas and Jetstar and
13.05 per cent per annum for Jetset Travelworld Group). The discount rates are based on the risk-free rate for the ten-year
Australian Government bonds adjusted for a risk premium to re ect both the increased risk of investing in equities and the
systematic risk of the speci c CGU.
Market share Qantas Group’s domestic market share is expected to remain between 64 and 65 per cent (2009: 65 and 66 per cent) and
international market share between 27 and 28 per cent (2009: 26 and 28 per cent). These ranges were estimated having
regard to the Qantas Group’s committed eet plans and those of its existing competitors.
Fuel The fuel into-plane price is assumed to be between US$103 and US$112 per barrel (2009: between US$82 and US$99)
and was set with regard to the forward fuel curve as at March 2010.
Currency The US$:A$ exchange rate is assumed to be between 92 and 93 cents (2009: 75.8 cents).
Fleet age The average eet age is forecast to be between 8.3 and 8.6 years (2009: between 8.5 and 8.9 years) and is estimated
having regard to the existing contractually committed long-term eet plan for the Qantas Group.
17. Intangible Assets continued