Memorex 2011 Annual Report Download - page 90
Download and view the complete annual report
Please find page 90 of the 2011 Memorex annual report below. You can navigate through the pages in the report by either clicking on the pages listed below, or by using the keyword search tool below to find specific information within the annual report.-
 1
1 -
2
-
3
-
4
-
5
-
6
-
7
-
8
-
9
-
10
-
11
-
12
-
13
-
14
-
15
-
16
-
17
-
18
-
19
-
20
-
21
-
22
-
23
-
24
-
25
-
26
-
27
-
28
-
29
-
30
-
31
-
32
-
33
-
34
-
35
-
36
-
37
-
38
-
39
-
40
-
41
-
42
-
43
-
44
-
45
-
46
-
47
-
48
-
49
-
50
-
51
-
52
-
53
-
54
-
55
-
56
-
57
-
58
-
59
-
60
-
61
-
62
-
63
-
64
-
65
-
66
-
67
-
68
-
69
-
70
-
71
-
72
-
73
-
74
-
75
-
76
-
77
-
78
-
79
-
 80
80 -
 81
81 -
 82
82 -
 83
83 -
 84
84 -
 85
85 -
 86
86 -
 87
87 -
 88
88 -
 89
89 -
 90
90 -
 91
91 -
 92
92 -
 93
93 -
 94
94 -
 95
95 -
 96
96 -
 97
97 -
 98
98 -
 99
99 -
 100
100 -
101
-
102
-
103
-
104
-
105
-
106
-
107
-
108
-
109
-
110
-
111
-
112
-
113
-
114
 |
 |

NOTES TO CONSOLIDATED FINANCIAL STATEMENTS — (Continued)
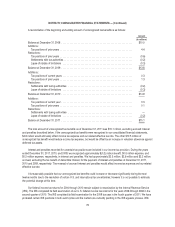
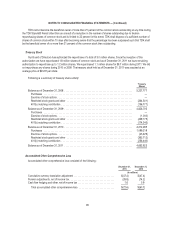
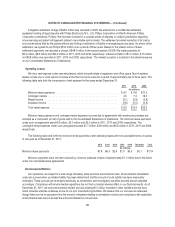
We have not provided specific asset information by segment, as it is not regularly provided to our chief operating
decision maker for review at a segment specific level. Corporate and unallocated amounts above include non-cash goodwill
impairment charges of $1.6 million and $23.5 million for the years ended December 31, 2011 and 2010, respectively, as well
as restructuring and other costs of $21.5 million, $51.1 million and $26.6 million for the years ended December 31, 2011,
2010 and 2009, respectively. Corporate and unallocated amounts above include a litigation settlement charge of $2.0 million,
$2.6 million and $49.0 million for the years ended December 31, 2011, 2010 and 2009, respectively.
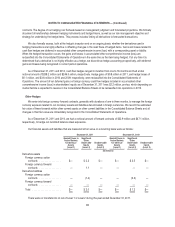
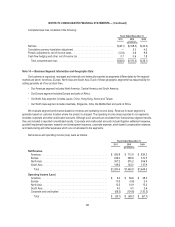
We have three major product categories: traditional storage, secure and scalable storage, and audio and video information.
Traditional storage products include optical products, magnetic products and other traditional storage media products. Optical
products include primarily DVDs, CDs and Blu-ray disc recordable media. Magnetic products include primarily data storage tape
media. Other traditional storage products include primarily optical drives and audio and video tape media. Secure and scalable
storage products include flash memory and hard disk drive products, including encrypted and biometric USB drives, encrypted
and biometric hard disk drives, secure portable desktop solutions, and software solutions, including products which contain
various security features such as password authentication, encryption and remote manageability, and data protection and data
archive appliances. Audio and video information products include primarily audio electronics such as portable CD players and
iPod clock radios and accessories such as CD and DVD jewel cases and headphones.
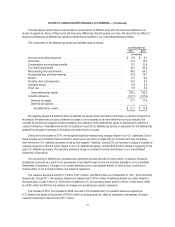
Net revenue by product category was as follows:
Years Ended December 31,
2011 2010 2009
(In millions)
Optical products ............................................. $ 511.9 $ 619.3 $ 738.0
Magnetic products ........................................... 327.4 347.8 406.0
Other traditional storage ....................................... 47.7 62.8 77.7
Total traditional storage ....................................... 887.0 1,029.9 1,221.7
Secure and scalable storage ................................... 210.1 207.5 165.4
Audio and video information .................................... 193.3 223.5 262.4
Total ................................................... $1,290.4 $1,460.9 $1,649.5
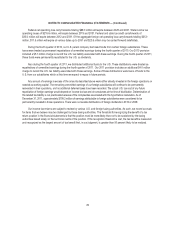
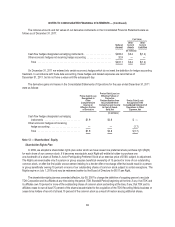
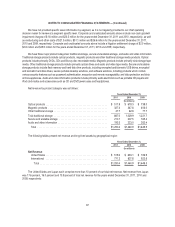
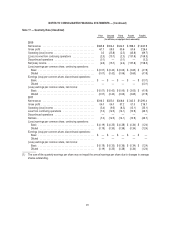
The following tables present net revenue and long-lived assets by geographical region:
Years Ended December 31,
2011 2010 2009
(In millions)
Net Revenue
United States ............................................. $ 519.2 $ 633.1 $ 726.9
International ............................................. 771.2 827.8 922.6
Total ................................................. $1,290.4 $1,460.9 $1,649.5
The United States and Japan each comprise more than 10 percent of our total net revenue. Net revenue from Japan
was 17.6 percent, 16.0 percent and 13.9 percent of total net revenue for the years ended December 31, 2011, 2010 and
2009, respectively.
87