Memorex 2011 Annual Report Download - page 77
Download and view the complete annual report
Please find page 77 of the 2011 Memorex annual report below. You can navigate through the pages in the report by either clicking on the pages listed below, or by using the keyword search tool below to find specific information within the annual report.-
 1
1 -
2
-
3
-
4
-
5
-
6
-
7
-
8
-
9
-
10
-
11
-
12
-
13
-
14
-
15
-
16
-
17
-
18
-
19
-
20
-
21
-
22
-
23
-
24
-
25
-
26
-
27
-
28
-
29
-
30
-
31
-
32
-
33
-
34
-
35
-
36
-
37
-
38
-
39
-
40
-
41
-
42
-
43
-
44
-
45
-
46
-
47
-
48
-
49
-
50
-
51
-
52
-
53
-
54
-
55
-
56
-
57
-
58
-
59
-
60
-
61
-
62
-
63
-
64
-
65
-
66
-
 67
67 -
 68
68 -
 69
69 -
 70
70 -
 71
71 -
 72
72 -
 73
73 -
 74
74 -
 75
75 -
 76
76 -
 77
77 -
 78
78 -
 79
79 -
 80
80 -
 81
81 -
 82
82 -
 83
83 -
 84
84 -
 85
85 -
 86
86 -
 87
87 -
88
-
89
-
90
-
91
-
92
-
93
-
94
-
95
-
96
-
97
-
98
-
99
-
100
-
101
-
102
-
103
-
104
-
105
-
106
-
107
-
108
-
109
-
110
-
111
-
112
-
113
-
114
 |
 |

NOTES TO CONSOLIDATED FINANCIAL STATEMENTS — (Continued)
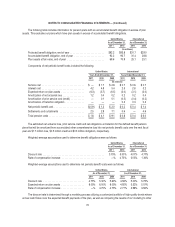
Fixed income securities:
Valued using quoted prices of the securities or, if unavailable, using quoted prices of securities with similar
characteristics in an active market.
Other investments include absolute return strategy funds which consist primarily of private partnership interests in hedge
funds and foreign government insurance contracts.
Mutual funds and absolute return strategy funds are valued using net asset value (NAV) of shares held as of
December 31, 2011. The NAV is a quoted transactional price for participants in the fund which do not represent an active
market. In relation to these investments, there are no unfunded commitments and shares can be redeemed with minimal
restrictions and can do so daily. Events that may lead to a restriction to transact with the funds are not considered probable.
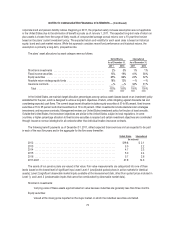
These methods may produce a fair value calculation that may not be indicative of the net realizable value or reflective of
future fair values. Furthermore, while we believe the valuation methods are appropriate and consistent with other market
participants, the use of different methodologies or assumptions to determine the fair value of certain financial instruments
could result in a different value measurement as of December 31, 2011. Investments, in general, are subject to various risks,
including credit, interest and overall market volatility risks. The December 31, 2010 fair value leveling disclosures were
revised to correct the presentation of certain investments in the U.S. pension plan as Level 2 equity securities rather than as
Level 3 equity securities, as previously disclosed. The effects of the change in disclosures are not considered material to the
financial statements. There were no transfers into or out of Level 1 or Level 2 during the year ended December 31, 2011.
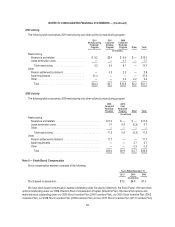
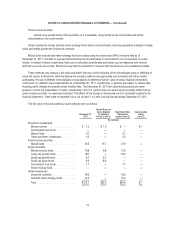
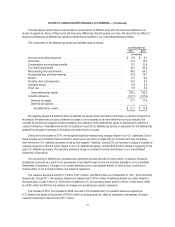
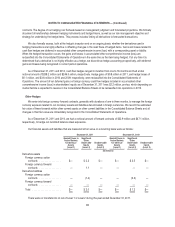
The fair value of the plan assets by asset category were as follows:
December 31,
2011
Quoted Prices in
Active Markets
for Identical
Assets (Level 1)
Significant Other
Observable
Inputs (Level 2)
Unobservable
Inputs
(Level 3)
(In millions)
Short-term investments:
Money markets .................... $ 1.5 $ 1.5 $ — $—
Commingled trust funds .............. — — — —
Mutual funds ...................... 0.1 — 0.1 —
Other short-term investments .......... 0.2 — 0.2 —
Fixed income securities:
Mutual funds ...................... 32.6 10.7 21.9 —
Equity securities:
Blended mutual funds ............... 19.8 6.8 13.0 —
Large-cap growth funds .............. 18.0 — 18.0 —
Small-cap growth funds .............. 6.7 6.7 — —
Small-cap value funds ............... 6.6 6.6 — —
Commingled trust funds .............. 7.1 — 7.1 —
Growth mutual funds ................ — — — —
Other investments:
Insurance contracts ................. 18.3 — 18.3 —
Absolute return strategy funds ......... 12.2 — 12.2 —
Total ............................ $123.1 $32.3 $90.8 $—
74