Memorex 2011 Annual Report Download - page 24
Download and view the complete annual report
Please find page 24 of the 2011 Memorex annual report below. You can navigate through the pages in the report by either clicking on the pages listed below, or by using the keyword search tool below to find specific information within the annual report.-
 1
1 -
2
-
3
-
4
-
5
-
6
-
7
-
8
-
9
-
10
-
11
-
12
-
13
-
 14
14 -
 15
15 -
 16
16 -
 17
17 -
 18
18 -
 19
19 -
 20
20 -
 21
21 -
 22
22 -
 23
23 -
 24
24 -
 25
25 -
 26
26 -
 27
27 -
 28
28 -
 29
29 -
 30
30 -
 31
31 -
 32
32 -
 33
33 -
 34
34 -
35
-
36
-
37
-
38
-
39
-
40
-
41
-
42
-
43
-
44
-
45
-
46
-
47
-
48
-
49
-
50
-
51
-
52
-
53
-
54
-
55
-
56
-
57
-
58
-
59
-
60
-
61
-
62
-
63
-
64
-
65
-
66
-
67
-
68
-
69
-
70
-
71
-
72
-
73
-
74
-
75
-
76
-
77
-
78
-
79
-
80
-
81
-
82
-
83
-
84
-
85
-
86
-
87
-
88
-
89
-
90
-
91
-
92
-
93
-
94
-
95
-
96
-
97
-
98
-
99
-
100
-
101
-
102
-
103
-
104
-
105
-
106
-
107
-
108
-
109
-
110
-
111
-
112
-
113
-
114
 |
 |

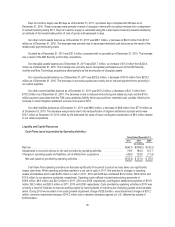
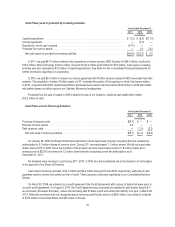
2011 Cash Flow/Financial Condition
• Cash and cash equivalents totaled $223.1 million as of December 31, 2011 compared with $304.9 million as of
December 31, 2010.
• Cash flow used in operating activities was $16.3 million for 2011 compared with cash flow provided by operating
activities of $151.4 million for 2010.
Results of Operations
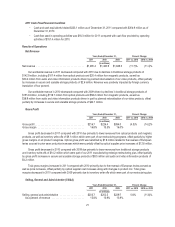
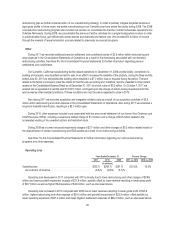
Net Revenue
Years Ended December 31, Percent Change
2011 2010 2009 2011 vs. 2010 2010 vs. 2009
(In millions)
Net revenue ................................... $1,290.4 $1,460.9 $1,649.5 (11.7)% (11.4)%
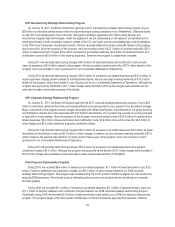
Our worldwide revenue in 2011 decreased compared with 2010 due to declines in traditional storage products of
$142.9 million, including $107.4 million from optical products and $20.4 million from magnetic products, as well as
$30.2 million from audio and video information products driven by planned rationalization of our video products, offset partially
by increases in secure and scalable storage products of $2.6 million. Revenue was positively impacted by foreign currency
translation of four percent.
Our worldwide revenue in 2010 decreased compared with 2009 driven by declines in traditional storage products of
$191.8 million, including $118.7 million from optical products and $58.2 million from magnetic products, as well as
$38.9 million from audio and video information products driven in part by planned rationalization of our video products, offset
partially by increases in secure and scalable storage products of $42.1 million.
Gross Profit
Years Ended December 31, Percent Change
2011 2010 2009 2011 vs. 2010 2010 vs. 2009
(In millions)
Gross profit .................................... $216.7 $226.4 $264.0 (4.3)% (14.2)%
Gross margin .................................. 16.8% 15.5% 16.0%
Gross profit decreased in 2011 compared with 2010 due primarily to lower revenues from optical products and magnetic
products, as well as inventory write-offs of $9.1 million which were part of our restructuring programs, offset partially by higher
gross margins on all product categories. Optical gross profit was benefited by $7.8 million related to the reversal of European
levies accrued in prior years and price increases which were partially offset by optical supplier price increases of $12.8 million.
Gross profit decreased in 2010 compared with 2009 due primarily to lower revenues from traditional storage products
and inventory write-offs of $14.2 million which were part of our 2011 manufacturing redesign restructuring plan, offset partially
by gross profit increases in secure and scalable storage products of $9.5 million and audio and video information products of
$4.2 million.
Total gross margins increased in 2011 compared with 2010 primarily due to the reversal of European levies accrued as
well as price increases, offset partially by optical supplier cost increases along with changes in product mix. Total gross
margins decreased in 2010 compared with 2009 primarily due to inventory write-offs which were part of our restructuring plan.
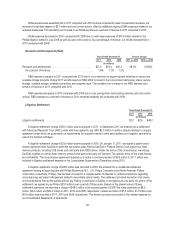
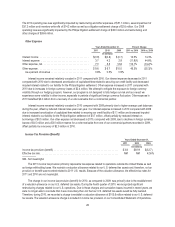
Selling, General and Administrative (SG&A)
Years Ended December 31, Percent Change
2011 2010 2009 2011 vs. 2010 2010 vs. 2009
(In millions)
Selling, general and administrative .................. $203.7 $202.5 $229.7 0.6% (11.8)%
As a percent of revenue ........................ 15.8% 13.9% 13.9%
21