Memorex 2011 Annual Report Download - page 30
Download and view the complete annual report
Please find page 30 of the 2011 Memorex annual report below. You can navigate through the pages in the report by either clicking on the pages listed below, or by using the keyword search tool below to find specific information within the annual report.-
 1
1 -
2
-
3
-
4
-
5
-
6
-
7
-
8
-
9
-
10
-
11
-
12
-
13
-
14
-
15
-
16
-
17
-
18
-
19
-
 20
20 -
 21
21 -
 22
22 -
 23
23 -
 24
24 -
 25
25 -
 26
26 -
 27
27 -
 28
28 -
 29
29 -
 30
30 -
 31
31 -
 32
32 -
 33
33 -
 34
34 -
 35
35 -
 36
36 -
 37
37 -
 38
38 -
 39
39 -
 40
40 -
41
-
42
-
43
-
44
-
45
-
46
-
47
-
48
-
49
-
50
-
51
-
52
-
53
-
54
-
55
-
56
-
57
-
58
-
59
-
60
-
61
-
62
-
63
-
64
-
65
-
66
-
67
-
68
-
69
-
70
-
71
-
72
-
73
-
74
-
75
-
76
-
77
-
78
-
79
-
80
-
81
-
82
-
83
-
84
-
85
-
86
-
87
-
88
-
89
-
90
-
91
-
92
-
93
-
94
-
95
-
96
-
97
-
98
-
99
-
100
-
101
-
102
-
103
-
104
-
105
-
106
-
107
-
108
-
109
-
110
-
111
-
112
-
113
-
114
 |
 |

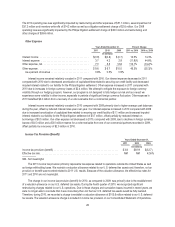
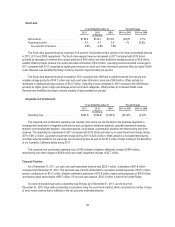
Other items that had an impact on the 2010 effective tax rate included a change in the state tax effective rate, reserves
for uncertain tax positions, foreign earnings subject to U.S. taxation, and changes in the mix of income by jurisdiction. See
Note 10 to the Consolidated Financial Statements for further information.
Items that had an impact on the 2009 effective tax rate include an increase in the state tax effective rate, additional
reserves for uncertain tax positions and the change in proportion of income by jurisdiction.
As of December 31, 2011 and 2010 we had valuation allowances of $141.1 million and $127.4 million, respectively, to
account for deferred tax assets we have concluded are not considered to be more-likely-than-not to be realized in the future
due to our cumulative losses in recent years. The deferred tax assets subject to valuation allowance include certain U.S. and
foreign operating loss carryforwards, certain U.S. deferred tax deductions, and certain tax credit carryforwards.
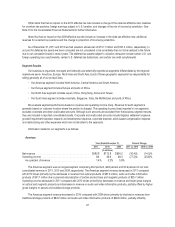
Segment Results
Our business is organized, managed and internally and externally reported as segments differentiated by the regional
markets we serve: Americas, Europe, North Asia and South Asia. Each of these geographic segments has responsibility for
selling generally all of our product lines.
• Our Americas segment includes North America, Central America and South America.
• Our Europe segment includes Europe and parts of Africa.
• Our North Asia segment includes Japan, China, Hong Kong, Korea and Taiwan.
• Our South Asia segment includes Australia, Singapore, India, the Middle East and parts of Africa.
We evaluate segment performance based on revenue and operating income (loss). Revenue for each segment is
generally based on customer location where the product is shipped. The operating income (loss) reported in our segments
excludes corporate and other unallocated amounts. Although such amounts are excluded from the business segment results,
they are included in reported consolidated results. Corporate and unallocated amounts include litigation settlement expense,
goodwill impairment expense, research and development expense, corporate expense, stock-based compensation expense
and restructuring and other expenses which are not allocated to the segments.
Information related to our segments is as follows:
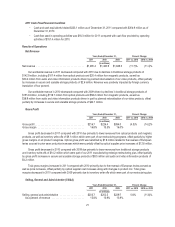
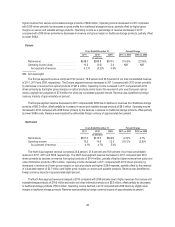
Americas
Years Ended December 31, Percent Change
2011 2010 2009 2011 vs. 2010 2010 vs. 2009
(In millions)
Net revenue ....................................... $595.9 $712.9 $834.2 (16.4)% (14.5)%
Operating income .................................. 8.4 36.8 48.3 (77.2)% (23.8)%
As a percent of revenue ............................ 1.4% 5.2% 5.8%
The Americas segment was our largest segment comprising 46.2 percent, 48.8 percent and 50.6 percent of our total
consolidated revenue in 2011, 2010 and 2009, respectively. The Americas segment revenue decreased in 2011 compared
with 2010 driven primarily by the decreases in revenue from optical products of $57.3 million, audio and video information
products of $41.1 million due to planned rationalization of certain product lines and magnetic products of $25.7 million.
Operating income decreased in 2011 compared with 2010 driven primarily by decreases in revenue and lower gross margins
on optical and magnetic products and decreases in revenue on audio and video information products, partially offset by higher
gross margins on secure and scalable storage products.
The Americas segment revenue decreased in 2010 compared with 2009 driven primarily by declines in revenues from
traditional storage products of $82.2 million and audio and video information products of $48.8 million, partially offset by
27