Memorex 2011 Annual Report Download - page 23
Download and view the complete annual report
Please find page 23 of the 2011 Memorex annual report below. You can navigate through the pages in the report by either clicking on the pages listed below, or by using the keyword search tool below to find specific information within the annual report.-
 1
1 -
2
-
3
-
4
-
5
-
6
-
7
-
8
-
9
-
10
-
11
-
12
-
 13
13 -
 14
14 -
 15
15 -
 16
16 -
 17
17 -
 18
18 -
 19
19 -
 20
20 -
 21
21 -
 22
22 -
 23
23 -
 24
24 -
 25
25 -
 26
26 -
 27
27 -
 28
28 -
 29
29 -
 30
30 -
 31
31 -
 32
32 -
 33
33 -
34
-
35
-
36
-
37
-
38
-
39
-
40
-
41
-
42
-
43
-
44
-
45
-
46
-
47
-
48
-
49
-
50
-
51
-
52
-
53
-
54
-
55
-
56
-
57
-
58
-
59
-
60
-
61
-
62
-
63
-
64
-
65
-
66
-
67
-
68
-
69
-
70
-
71
-
72
-
73
-
74
-
75
-
76
-
77
-
78
-
79
-
80
-
81
-
82
-
83
-
84
-
85
-
86
-
87
-
88
-
89
-
90
-
91
-
92
-
93
-
94
-
95
-
96
-
97
-
98
-
99
-
100
-
101
-
102
-
103
-
104
-
105
-
106
-
107
-
108
-
109
-
110
-
111
-
112
-
113
-
114
 |
 |
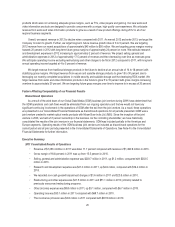
products which were not achieving adequate gross margins, such as TVs, video players and gaming. Our new audio and
video information products are designed to provide consumers with a unique, high quality user experience. We anticipate
revenue from audio and video information products to grow as a result of new product offerings during 2012 in all of our
regional business segments.
Overall, we expect revenue in 2012 to decline when compared with 2011. As we exit 2012 and enter 2013, we target the
Company to return to growth. Further, we target long-term future revenue growth rates of 3 to 5 percent. We are targeting
2012 revenue from our recent acquisitions of approximately $45 million to $50 million. We are targeting gross margins moving
towards 20 percent in 2012 with long-term future gross margins of approximately 20 percent or more. We estimate research
and development expenses in 2012 increasing to approximately 2 percent of revenue. We project selling, general and
administrative expenses in 2012 of approximately 17.5 percent of revenue and then decreasing over time as revenues grow.
We anticipate operating income excluding restructuring and other charges to be flat in 2012 compared to 2011, with long-term
annual operating income targeted at 4 to 5 percent of revenue.
We target revenue from traditional storage products in the future to decline at an annual rate of 14 to 18 percent with
stabilizing gross margins. We target revenue from secure and scalable storage products to grow 15 to 30 percent due to
leveraging our recently completed acquisitions in mobile security and scalable storage and the developing RDX market. We
target revenue from audio and video information products in the future to grow 5 to 15 percent with gross margins increasing
overtime to approximately 20 percent. We are targeting future gross margins over time to improve to in excess of 20 percent.
Factors Affecting Comparability of our Financial Results
Discontinued Operations
As a result of the wind down of our Global Data Media (GDM) business joint venture during 2009 it was determined that
the GDM operations and cash flows would be eliminated from our ongoing operations and that we would not have any
significant continuing involvement in the operations of GDM after the exit from the joint venture. As a result, these operations
are presented in our Consolidated Financial Statements as discontinued operations for all periods presented. GDM was a
joint venture created to market optical media products with Moser Baer India Ltd. (MBI). Since the inception of the joint
venture in 2003, we held a 51 percent ownership in the business. As the controlling shareholder, we have historically
consolidated the results of the joint venture in our financial statements. GDM was included partially in the Americas and
Europe segments. Operating results of the GDM business joint venture are included as discontinued operations for the
current period and all prior periods presented in the Consolidated Statements of Operations. See Note 4 to the Consolidated
Financial Statements for further information.
Executive Summary
2011 Consolidated Results of Operations
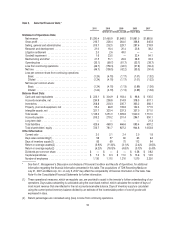
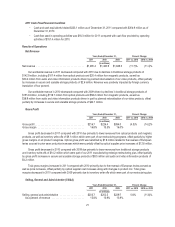
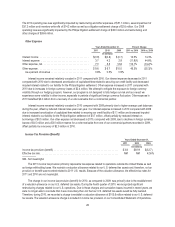
• Revenue of $1,290.4 million in 2011 was down 11.7 percent compared with revenue of $1,460.9 million in 2010.
• Gross margin of 16.8 percent in 2011 was up from 15.5 percent in 2010.
• Selling, general and administrative expense was $203.7 million in 2011, up $1.2 million, compared with $202.5
million in 2010.
• Research and development expense was $21.0 million in 2011, up $4.6 million, compared with $16.4 million in
2010.
• We recorded non-cash goodwill impairment charges of $1.6 million in 2011 and $23.5 million in 2010.
• Restructuring and other expense was $21.5 million in 2011 and $51.1 million in 2010, primarily related to
previously announced restructuring programs.
• Other (income) expense was $9.8 million in 2011, up $3.1 million, compared with $6.7 million in 2010.
• Operating loss was $33.1 million in 2011 compared with $69.7 million in 2010.
• The income tax provision was $3.8 million in 2011 compared with $81.9 million in 2010.
20