Memorex 2011 Annual Report Download - page 21
Download and view the complete annual report
Please find page 21 of the 2011 Memorex annual report below. You can navigate through the pages in the report by either clicking on the pages listed below, or by using the keyword search tool below to find specific information within the annual report.-
 1
1 -
2
-
3
-
4
-
5
-
6
-
7
-
8
-
9
-
10
-
 11
11 -
 12
12 -
 13
13 -
 14
14 -
 15
15 -
 16
16 -
 17
17 -
 18
18 -
 19
19 -
 20
20 -
 21
21 -
 22
22 -
 23
23 -
 24
24 -
 25
25 -
 26
26 -
 27
27 -
 28
28 -
 29
29 -
 30
30 -
 31
31 -
32
-
33
-
34
-
35
-
36
-
37
-
38
-
39
-
40
-
41
-
42
-
43
-
44
-
45
-
46
-
47
-
48
-
49
-
50
-
51
-
52
-
53
-
54
-
55
-
56
-
57
-
58
-
59
-
60
-
61
-
62
-
63
-
64
-
65
-
66
-
67
-
68
-
69
-
70
-
71
-
72
-
73
-
74
-
75
-
76
-
77
-
78
-
79
-
80
-
81
-
82
-
83
-
84
-
85
-
86
-
87
-
88
-
89
-
90
-
91
-
92
-
93
-
94
-
95
-
96
-
97
-
98
-
99
-
100
-
101
-
102
-
103
-
104
-
105
-
106
-
107
-
108
-
109
-
110
-
111
-
112
-
113
-
114
 |
 |

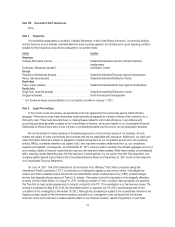
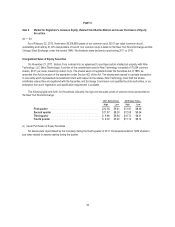
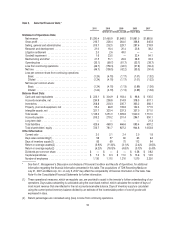
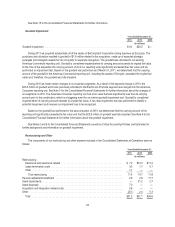
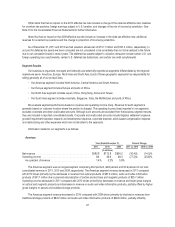
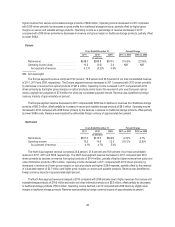
Item 6. Selected Financial Data.*
2011 2010 2009 2008 2007
(Dollars in millions, except per share data)
Statement of Operations Data:
Net revenue ................................... $1,290.4 $1,460.9 $1,649.5 $1,981.0 $1,895.8
Gross profit .................................... 216.7 226.4 264.0 338.8 345.8
Selling, general and administrative ................... 203.7 202.5 229.7 287.6 218.9
Research and development ........................ 21.0 16.4 20.4 23.6 38.2
Litigation settlement ............................. 2.0 2.6 49.0 — —
Goodwill impairment ............................. 1.6 23.5 — 32.4 94.1
Restructuring and other ........................... 21.5 51.1 26.6 28.9 33.3
Operating loss .................................. (33.1) (69.7) (61.7) (33.7) (38.7)
Loss from continuing operations .................... (46.7) (158.3) (44.0) (37.8) (56.4)
Net loss ...................................... (46.7) (158.5) (42.2) (33.3) (50.4)
Loss per common share from continuing operations:
Basic ...................................... (1.24) (4.19) (1.17) (1.01) (1.52)
Diluted ..................................... (1.24) (4.19) (1.17) (1.01) (1.52)
Net loss per common share:
Basic ...................................... (1.24) (4.19) (1.13) (0.89) (1.36)
Diluted ..................................... (1.24) (4.19) (1.13) (0.89) (1.36)
Balance Sheet Data:
Cash and cash equivalents ........................ $ 223.1 $ 304.9 $ 163.4 $ 96.6 $ 135.5
Accounts receivable, net .......................... 234.9 258.8 314.9 378.3 507.1
Inventories .................................... 208.8 203.3 235.7 363.2 366.1
Property, plant and equipment, net .................. 55.4 66.9 109.8 122.4 171.5
Intangible assets, net ............................ 321.7 320.4 337.3 357.0 371.0
Total assets ................................... 1,149.3 1,251.0 1,393.8 1,540.0 1,751.0
Accounts payable ............................... 205.2 219.2 201.4 296.1 350.1
Long-term debt ................................. ————21.3
Total liabilities .................................. 425.6 469.3 466.6 595.4 697.2
Total shareholders’ equity ......................... 723.7 781.7 927.2 944.6 1,053.8
Other Information:
Current ratio ................................... 2.0 2.1 2.4 2.0 1.8
Days sales outstanding(1) ......................... 58 57 60 63 64
Days of inventory supply(1) ........................ 85 69 75 112 94
Return on average assets(2) ....................... (3.9)% (11.8)% (3.1)% (2.4)% (3.6)%
Return on average equity(2) ....................... (6.2)% (18.0)% (4.8)% (3.7)% (5.4)%
Dividends per common share ...................... $ — $ — $ — $ 0.56 $ 0.62
Capital expenditures ............................. $ 7.3 $ 8.3 $ 11.0 $ 13.6 $ 14.5
Number of employees ............................ 1,130 1,115 1,210 1,570 2,250
* See Item 7. Management’s Discussion and Analysis of Financial Condition and Results of Operations, for additional
information regarding the financial information presented in this table. The acquisitions of TDK Recording Media on
July 31, 2007 and Memcorp, Inc. on July 9, 2007 may affect the comparability of financial information in this table. See
Note 4 to the Consolidated Financial Statements for further information.
(1) These operational measures, which we regularly use, are provided to assist in the investor’s further understanding of our
operations. Days sales outstanding is calculated using the count-back method, which calculates the number of days of
most recent revenue that are reflected in the net accounts receivable balance. Days of inventory supply is calculated
using the current period inventory balance divided by an estimate of the inventoriable portion of cost of goods sold
expressed in days.
(2) Return percentages are calculated using (loss) income from continuing operations.
18