Memorex 2011 Annual Report Download - page 89
Download and view the complete annual report
Please find page 89 of the 2011 Memorex annual report below. You can navigate through the pages in the report by either clicking on the pages listed below, or by using the keyword search tool below to find specific information within the annual report.-
 1
1 -
2
-
3
-
4
-
5
-
6
-
7
-
8
-
9
-
10
-
11
-
12
-
13
-
14
-
15
-
16
-
17
-
18
-
19
-
20
-
21
-
22
-
23
-
24
-
25
-
26
-
27
-
28
-
29
-
30
-
31
-
32
-
33
-
34
-
35
-
36
-
37
-
38
-
39
-
40
-
41
-
42
-
43
-
44
-
45
-
46
-
47
-
48
-
49
-
50
-
51
-
52
-
53
-
54
-
55
-
56
-
57
-
58
-
59
-
60
-
61
-
62
-
63
-
64
-
65
-
66
-
67
-
68
-
69
-
70
-
71
-
72
-
73
-
74
-
75
-
76
-
77
-
78
-
 79
79 -
 80
80 -
 81
81 -
 82
82 -
 83
83 -
 84
84 -
 85
85 -
 86
86 -
 87
87 -
 88
88 -
 89
89 -
 90
90 -
 91
91 -
 92
92 -
 93
93 -
 94
94 -
 95
95 -
 96
96 -
 97
97 -
 98
98 -
 99
99 -
100
-
101
-
102
-
103
-
104
-
105
-
106
-
107
-
108
-
109
-
110
-
111
-
112
-
113
-
114
 |
 |

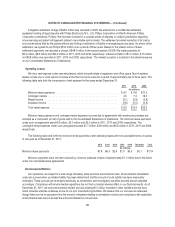
NOTES TO CONSOLIDATED FINANCIAL STATEMENTS — (Continued)
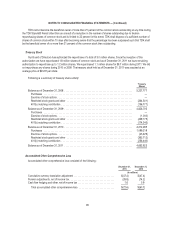
Comprehensive loss consisted of the following:
Years Ended December 31,
2011 2010 2009
(In millions)
Net loss ....................................................... $(46.7) $(158.5) $(42.2)
Cumulative currency translation adjustment ............................. — 3.0 4.5
Pension adjustments, net of income taxes .............................. (12.6) 4.6 9.8
Cash flow hedging and other, net of income tax .......................... 0.7 0.6 1.8
Total comprehensive loss ........................................ $(58.6) $(150.3) $(26.1)
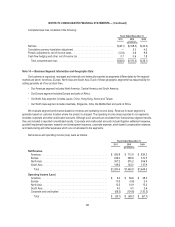
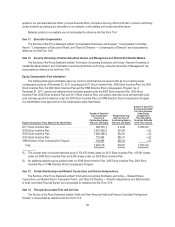
Note 14 — Business Segment Information and Geographic Data
Our business is organized, managed and internally and externally reported as segments differentiated by the regional
markets we serve: Americas, Europe, North Asia and South Asia. Each of these geographic segments has responsibility for
selling generally all of our product lines.
• Our Americas segment includes North America, Central America and South America.
• Our Europe segment includes Europe and parts of Africa.
• Our North Asia segment includes Japan, China, Hong Kong, Korea and Taiwan.
• Our South Asia segment includes Australia, Singapore, India, the Middle East and parts of Africa.
We evaluate segment performance based on revenue and operating income (loss). Revenue for each segment is
generally based on customer location where the product is shipped. The operating income (loss) reported in our segments
excludes corporate and other unallocated amounts. Although such amounts are excluded from the business segment results,
they are included in reported consolidated results. Corporate and unallocated amounts include litigation settlement expense,
goodwill impairment expense, research and development expense, corporate expense, stock-based compensation expense
and restructuring and other expenses which are not allocated to the segments.
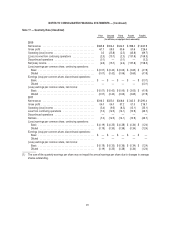
Net revenue and operating income (loss) were as follows:
Years Ended December 31,
2011 2010 2009
(In millions)
Net Revenue
Americas ................................................ $ 595.9 $ 712.9 $ 834.2
Europe ................................................. 248.0 289.8 370.5
North Asia ............................................... 307.2 315.2 306.9
South Asia ............................................... 139.3 143.0 137.9
Total ................................................. $1,290.4 $1,460.9 $1,649.5
Operating Income (Loss)
Americas ................................................ $ 8.4 $ 36.8 $ 48.3
Europe ................................................. 10.3 (0.6) 2.4
North Asia ............................................... 12.5 14.9 15.3
South Asia ............................................... 4.0 4.0 2.6
Corporate and unallocated ................................... (68.3) (124.8) (130.3)
Total ................................................. $ (33.1) $ (69.7) $ (61.7)
86