Memorex 2011 Annual Report Download - page 8
Download and view the complete annual report
Please find page 8 of the 2011 Memorex annual report below. You can navigate through the pages in the report by either clicking on the pages listed below, or by using the keyword search tool below to find specific information within the annual report.-
 1
1 -
 2
2 -
 3
3 -
 4
4 -
 5
5 -
 6
6 -
 7
7 -
 8
8 -
 9
9 -
 10
10 -
 11
11 -
 12
12 -
 13
13 -
 14
14 -
 15
15 -
 16
16 -
 17
17 -
 18
18 -
 19
19 -
20
-
21
-
22
-
23
-
24
-
25
-
26
-
27
-
28
-
29
-
30
-
31
-
32
-
33
-
34
-
35
-
36
-
37
-
38
-
39
-
40
-
41
-
42
-
43
-
44
-
45
-
46
-
47
-
48
-
49
-
50
-
51
-
52
-
53
-
54
-
55
-
56
-
57
-
58
-
59
-
60
-
61
-
62
-
63
-
64
-
65
-
66
-
67
-
68
-
69
-
70
-
71
-
72
-
73
-
74
-
75
-
76
-
77
-
78
-
79
-
80
-
81
-
82
-
83
-
84
-
85
-
86
-
87
-
88
-
89
-
90
-
91
-
92
-
93
-
94
-
95
-
96
-
97
-
98
-
99
-
100
-
101
-
102
-
103
-
104
-
105
-
106
-
107
-
108
-
109
-
110
-
111
-
112
-
113
-
114
 |
 |
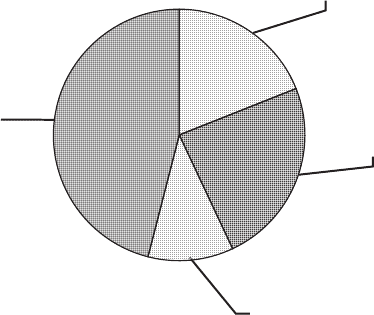
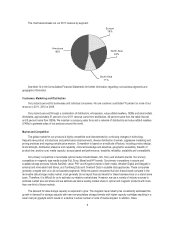
The chart below breaks out our 2011 revenue by segment:
Europe
19%
A
mericas
46% North Asia
24%
South Asia
11%
See Note 14 to the Consolidated Financial Statements for further information regarding our business segments and
geographic information.
Customers, Marketing and Distribution
Our products are sold to businesses and individual consumers. No one customer constituted 10 percent or more of our
revenue in 2011, 2010 or 2009.
Our products are sold through a combination of distributors, wholesalers, value-added resellers, OEMs and retail outlets.
Worldwide, approximately 51 percent of our 2011 revenue came from distributors, 46 percent came from the retail channel
and 3 percent came from OEMs. We maintain a company sales force and a network of distributors and value-added resellers
(VARs) to generate sales of our products around the world.
Market and Competition
The global market for our products is highly competitive and characterized by continuing changes in technology,
frequent new product introductions and performance improvements, diverse distribution channels, aggressive marketing and
pricing practices and ongoing variable price erosion. Competition is based on a multitude of factors, including product design,
brand strength, distribution presence and capability, channel knowledge and expertise, geographic availability, breadth of
product line, product cost, media capacity, access speed and performance, durability, reliability, scalability and compatibility.
Our primary competitors in recordable optical media include Maxell, JVC, Sony and Verbatim brands. Our primary
competitors in magnetic tape media include Fuji, Sony, Maxell and HP brands. Our primary competitors in secure and
scalable storage products include SanDisk, Lexar, PNY and Kingston brands in flash media, Western Digital and Seagate in
external and removable hard drives, and Tandberg Data and Overland Data in scalable data appliances. These companies
generally compete with us in all our business segments. While the parent companies that own these brands compete in the
removable data storage media market, most generally do not report financial results for these business lines on a stand-alone
basis. Therefore, it is difficult for us to estimate our relative market share. However, we use a variety of industry sources to
estimate market size and share and we estimate we held a leading market share in optical and magnetic products with more
than one-third of those markets.
The demand for data storage capacity is expected to grow. The magnetic tape industry has consistently addressed the
growth in demand for storage capacity with new non-proprietary storage formats with higher capacity cartridges resulting in a
lower cost per gigabyte which results in a decline in actual number of units of media shipped. In addition, these
5