Memorex 2011 Annual Report Download - page 33
Download and view the complete annual report
Please find page 33 of the 2011 Memorex annual report below. You can navigate through the pages in the report by either clicking on the pages listed below, or by using the keyword search tool below to find specific information within the annual report.-
 1
1 -
2
-
3
-
4
-
5
-
6
-
7
-
8
-
9
-
10
-
11
-
12
-
13
-
14
-
15
-
16
-
17
-
18
-
19
-
20
-
21
-
22
-
 23
23 -
 24
24 -
 25
25 -
 26
26 -
 27
27 -
 28
28 -
 29
29 -
 30
30 -
 31
31 -
 32
32 -
 33
33 -
 34
34 -
 35
35 -
 36
36 -
 37
37 -
 38
38 -
 39
39 -
 40
40 -
 41
41 -
 42
42 -
 43
43 -
44
-
45
-
46
-
47
-
48
-
49
-
50
-
51
-
52
-
53
-
54
-
55
-
56
-
57
-
58
-
59
-
60
-
61
-
62
-
63
-
64
-
65
-
66
-
67
-
68
-
69
-
70
-
71
-
72
-
73
-
74
-
75
-
76
-
77
-
78
-
79
-
80
-
81
-
82
-
83
-
84
-
85
-
86
-
87
-
88
-
89
-
90
-
91
-
92
-
93
-
94
-
95
-
96
-
97
-
98
-
99
-
100
-
101
-
102
-
103
-
104
-
105
-
106
-
107
-
108
-
109
-
110
-
111
-
112
-
113
-
114
 |
 |

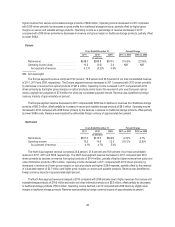
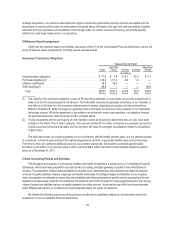
Days of inventory supply was 85 days as of December 31, 2011, up sixteen days compared with 69 days as of
December 31, 2010. These increases were primarily a result of changes in terms with our optical vendors from consignment
to owned inventory during 2011. Days of inventory supply is calculated using the current period inventory balance divided by
an estimate of the inventoriable portion of cost of goods sold expressed in days.
Our other current assets balance as of December 31, 2011 was $49.7 million, a decrease of $24.5 million from $74.2
million as of December 31, 2010. The decrease was primarily due to decreased restricted cash balances as the result of the
related cash payments being made.
Goodwill as of December 31, 2011 was $31.3 million compared with no goodwill as of December 31, 2010. The increase
was a result of the MXI Security and IronKey acquisitions.
Our intangible assets balance as of December 31, 2011 was $321.7 million, an increase of $1.3 million from $320.4
million as of December 31, 2010. The increase was primarily due to intangibles purchased as part of the MXI Security,
IronKey and Nine Technology acquisitions offset partially by the amortization of intangible assets.
Our accounts payable balance as of December 31, 2011 was $205.2 million, a decrease of $14.0 million from $219.2
million as of December 31, 2010. The decrease in accounts payable was mainly due to reduced payment terms primarily to
our optical suppliers.
Our other current liabilities balance as of December 31, 2011 was $151.2 million, a decrease of $21.1 million from
$172.3 million as of December 31, 2010. The decrease is due to reduced restructuring and rebate accruals and the $10.5
million payment associated with the TDK value added tax liability which was paid from restricted cash, partially offset by the
increase in current litigation settlement accruals to be paid in 2012.
Our other liabilities balance as of December 31, 2011 was $69.2 million, a decrease of $8.6 million from $77.8 million as
of December 31, 2010. The decrease was primarily due to the reclassification of litigation settlement accruals which were
$15.1 million at December 31, 2010, offset by the estimated fair value of future contingent consideration of $9.2 million related
to our recent acquisitions.
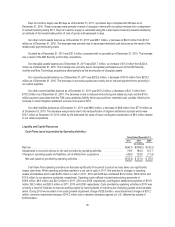
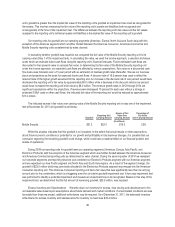
Liquidity and Capital Resources
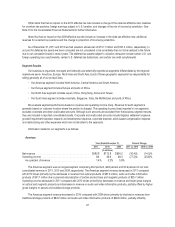
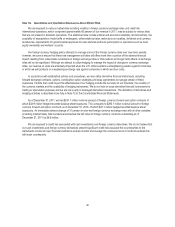
Cash Flows (used in) provided by Operating Activities:
Years Ended December 31,
2011 2010 2009
(In millions)
Net loss .................................................................. $(46.7) $(158.5) $ (42.2)
Adjustments to reconcile net loss to net cash provided by operating activities ............... 73.9 185.4 121.1
Changes in operating assets and liabilities, net of effects from acquisitions ................. (43.5) 124.5 (11.4)
Net cash (used in) provided by operating activities ................................. $(16.3) $ 151.4 $ 67.5
Cash flows from operating activities can fluctuate significantly from period to period as many items can significantly
impact cash flows. While operating activities resulted in a net use of cash in 2011, this was due to changes in operating
assets and liabilities which used $43.5 million in cash. In 2011, 2010 and 2009 we contributed $14.2 million, $9.9 million and
$10.3 million to our pensions worldwide, respectively. Operating cash outflows included restructuring payments of
$16.9 million, $9.5 million and $22.3 million in 2011, 2010 and 2009, respectively, and litigation settlement payments of $10.9
million, $8.2 million and $20.0 million in 2011, 2010 and 2009, respectively. Cash provided by operating activities in 2010 was
primarily a result of initiatives to improve working capital by lowering levels of inventory and changing payable and receivable
terms. During 2010 we recorded a non-cash goodwill impairment charge of $23.5 million, asset impairment charges of $31.2
million, inventory impairment charges of $14.2 million and a valuation allowance against our U.S. deferred tax assets of
$105.6 million.
30