Logitech 2015 Annual Report Download - page 94
Download and view the complete annual report
Please find page 94 of the 2015 Logitech annual report below. You can navigate through the pages in the report by either clicking on the pages listed below, or by using the keyword search tool below to find specific information within the annual report.-
 1
1 -
2
-
3
-
4
-
5
-
6
-
7
-
8
-
9
-
10
-
11
-
12
-
13
-
14
-
15
-
16
-
17
-
18
-
19
-
20
-
21
-
22
-
23
-
24
-
25
-
26
-
27
-
28
-
29
-
30
-
31
-
32
-
33
-
34
-
35
-
36
-
37
-
38
-
39
-
40
-
41
-
42
-
43
-
44
-
45
-
46
-
47
-
48
-
49
-
50
-
51
-
52
-
53
-
54
-
55
-
56
-
57
-
58
-
59
-
60
-
61
-
62
-
63
-
64
-
65
-
66
-
67
-
68
-
69
-
70
-
71
-
72
-
73
-
74
-
75
-
76
-
77
-
78
-
79
-
80
-
81
-
82
-
83
-
 84
84 -
 85
85 -
 86
86 -
 87
87 -
 88
88 -
 89
89 -
 90
90 -
 91
91 -
 92
92 -
 93
93 -
 94
94 -
 95
95 -
 96
96 -
 97
97 -
 98
98 -
 99
99 -
 100
100 -
 101
101 -
 102
102 -
 103
103 -
 104
104 -
105
-
106
-
107
-
108
-
109
-
110
-
111
-
112
-
113
-
114
-
115
-
116
-
117
-
118
-
119
-
120
-
121
-
122
-
123
-
124
-
125
-
126
-
127
-
128
-
129
-
130
-
131
-
132
-
133
-
134
-
135
-
136
-
137
-
138
-
139
-
140
-
141
-
142
-
143
-
144
-
145
-
146
-
147
-
148
-
149
-
150
-
151
-
152
-
153
-
154
-
155
-
156
-
157
-
158
-
159
-
160
-
161
-
162
-
163
-
164
-
165
-
166
-
167
-
168
-
169
-
170
-
171
-
172
-
173
-
174
-
175
-
176
-
177
-
178
-
179
-
180
-
181
-
182
-
183
-
184
-
185
-
186
-
187
-
188
-
189
-
190
-
191
-
192
-
193
-
194
-
195
-
196
-
197
-
198
-
199
-
200
-
201
-
202
-
203
-
204
-
205
-
206
-
207
-
208
-
209
-
210
-
211
-
212
-
213
-
214
-
215
-
216
-
217
-
218
-
219
-
220
-
221
-
222
-
223
-
224
-
225
-
226
-
227
-
228
-
229
-
230
-
231
-
232
-
233
-
234
-
235
-
236
-
237
-
238
-
239
-
240
-
241
-
242
-
243
-
244
-
245
-
246
-
247
-
248
-
249
-
250
-
251
-
252
 |
 |

Compensation Report for Fiscal Year 2015
– Proxy Statement | 84
2015 Annual General Meeting Invitation, Proxy Statement
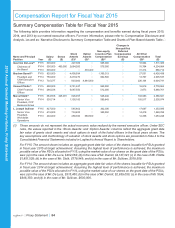
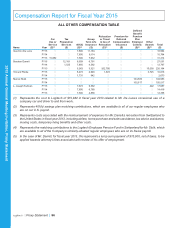
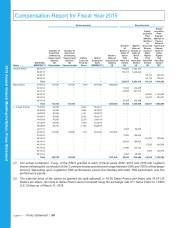
Summary Compensation Table for Fiscal Year 2015
The following table provides information regarding the compensation and benefits earned during fiscal years 2015,
2014, and 2013 by our named executive officers. For more information, please refer to “Compensation Disclosure and
Analysis,” as well as “Narrative Disclosure to Summary Compensation Table and Grants of Plan-Based Awards Table.”
Name and Principal
Position Year
Salary
($)
Bonus
($)
Stock
Awards
($)(1)
Option
Awards
($)(1)
Non-equity
Incentive Plan
Compensation
($)(2)
Changes in
Nonqualified
Deferred
Compensation
Earnings
($)
All Other
Compensation
($)(3)
Total
($)
Guerrino De Luca(4) FY15 500,000 — 427,389 — 565,000 — 18,994 1,511,383
Chairman of
the Board FY14 500,000 460,000 2,684,200 — 575,000 — 15,764 4,234,964
FY13 500,000 — — 335,400 — — 31,314 866,714
Bracken Darrell(5) FY15 825,000 — 4,408,594 — 1,165,313 — 27,531 6,426,438
President and
Chief Executive
Officer
FY14 750,000 — 3,279,270 — 862,500 — 13,767 4,905,537
FY13 735,577 — 803,000 4,840,000 — — 226,164 6,604,741
Vincent Pilette(6) FY15 500,000 — 2,701,247 — 560,000 — 16,816 3,778,063
Chief Financial
Officer FY14 286,538 — 5,067,550 — 512,000 — 2,673 5,868,761
Marcel Stolk(7) FY15 564,558 345,091 826,097 — 546,492 — 104,583 2,386,821
Senior Vice
President, CCP
Business Group
FY14 535,714 — 1,100,100 — 589,643 — 105,517 2,330,974
L. Joseph Sullivan FY15 427,500 — 545,602 — 362,306 — 17,687 1,353,095
Senior Vice
President,
Worldwide
Operations
FY14 415,000 — 733,400 — 385,950 — 14,418 1,548,768
FY13 402,000 — 258,390 580,500 — — 12,358 1,253,248
(1) These amounts do not represent the actual economic value realized by the named executive officer. Under SEC
rules, the values reported in the “Stock Awards” and “Option Awards” columns reflect the aggregate grant date
fair value of grants stock awards and stock options to each of the listed officers in the fiscal years shown. The
key assumptions and methodology of valuation of stock awards and stock options are presented in Note 4 to the
Consolidated Financial Statements included in Logitech’s Annual Report to Shareholders.
For FY15: The amount shown includes an aggregate grant date fair value of the shares issuable for PSUs granted
in fiscal year 2015 at target achievement. Assuming the highest level of performance is achieved, the maximum
possible value of the PSUs allocated in FY15, using the market value of our shares on the grant date of the PSUs,
was: (a) in the case of Mr. De Luca, $402,062; (b) in the case of Mr. Darrell, $4,147,341; (c) in the case of Mr. Pilette
$1,851,528; (d) in the case of Mr. Stolk, $779,949; and (e) in the case of Mr. Sullivan, $518,509.
For FY14: The amount shown includes an aggregate grant date fair value of the shares issuable for PSUs granted
in fiscal year 2014 at target achievement. Assuming the highest level of performance is achieved, the maximum
possible value of the PSUs allocated in FY14, using the market value of our shares on the grant date of the PSUs,
was: (a) in the case of Mr. De Luca, $315,450; (b) in the case of Mr. Darrell, $2,839,050; (c) in the case of Mr. Stolk,
$946,350; and (d) in the case of Mr. Sullivan, $630,900.