Logitech 2015 Annual Report Download - page 231
Download and view the complete annual report
Please find page 231 of the 2015 Logitech annual report below. You can navigate through the pages in the report by either clicking on the pages listed below, or by using the keyword search tool below to find specific information within the annual report.-
 1
1 -
2
-
3
-
4
-
5
-
6
-
7
-
8
-
9
-
10
-
11
-
12
-
13
-
14
-
15
-
16
-
17
-
18
-
19
-
20
-
21
-
22
-
23
-
24
-
25
-
26
-
27
-
28
-
29
-
30
-
31
-
32
-
33
-
34
-
35
-
36
-
37
-
38
-
39
-
40
-
41
-
42
-
43
-
44
-
45
-
46
-
47
-
48
-
49
-
50
-
51
-
52
-
53
-
54
-
55
-
56
-
57
-
58
-
59
-
60
-
61
-
62
-
63
-
64
-
65
-
66
-
67
-
68
-
69
-
70
-
71
-
72
-
73
-
74
-
75
-
76
-
77
-
78
-
79
-
80
-
81
-
82
-
83
-
84
-
85
-
86
-
87
-
88
-
89
-
90
-
91
-
92
-
93
-
94
-
95
-
96
-
97
-
98
-
99
-
100
-
101
-
102
-
103
-
104
-
105
-
106
-
107
-
108
-
109
-
110
-
111
-
112
-
113
-
114
-
115
-
116
-
117
-
118
-
119
-
120
-
121
-
122
-
123
-
124
-
125
-
126
-
127
-
128
-
129
-
130
-
131
-
132
-
133
-
134
-
135
-
136
-
137
-
138
-
139
-
140
-
141
-
142
-
143
-
144
-
145
-
146
-
147
-
148
-
149
-
150
-
151
-
152
-
153
-
154
-
155
-
156
-
157
-
158
-
159
-
160
-
161
-
162
-
163
-
164
-
165
-
166
-
167
-
168
-
169
-
170
-
171
-
172
-
173
-
174
-
175
-
176
-
177
-
178
-
179
-
180
-
181
-
182
-
183
-
184
-
185
-
186
-
187
-
188
-
189
-
190
-
191
-
192
-
193
-
194
-
195
-
196
-
197
-
198
-
199
-
200
-
201
-
202
-
203
-
204
-
205
-
206
-
207
-
208
-
209
-
210
-
211
-
212
-
213
-
214
-
215
-
216
-
217
-
218
-
219
-
220
-
 221
221 -
 222
222 -
 223
223 -
 224
224 -
 225
225 -
 226
226 -
 227
227 -
 228
228 -
 229
229 -
 230
230 -
 231
231 -
 232
232 -
 233
233 -
 234
234 -
 235
235 -
 236
236 -
 237
237 -
 238
238 -
 239
239 -
 240
240 -
 241
241 -
242
-
243
-
244
-
245
-
246
-
247
-
248
-
249
-
250
-
251
-
252
 |
 |

LOGITECH INTERNATIONAL S.A.
NOTES TO CONSOLIDATED FINANCIAL STATEMENTS (Continued)
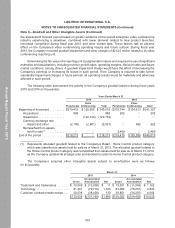
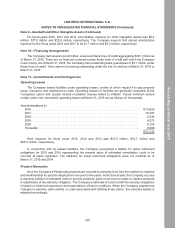
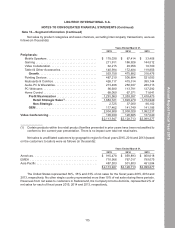
Net sales by product categories and sales channels, excluding intercompany transactions, were as
follows (in thousands):
Years Ended March 31,
2015 2014 2013
Peripherals:
Mobile Speakers . . . . . . . . . . . . . . . . . . . . . . . . . . . . . . . $ 178,038 $ 87,414 $ 33,408
Gaming . . . . . . . . . . . . . . . . . . . . . . . . . . . . . . . . . . . . . . 211,911 186,926 144,512
Video Collaboration. . . . . . . . . . . . . . . . . . . . . . . . . . . . . 62,215 29,058 18,700
Tablet & Other Accessories. . . . . . . . . . . . . . . . . . . . . . . 140,994 172,484 119,856
Growth. . . . . . . . . . . . . . . . . . . . . . . . . . . . . . . . . . . . 593,158 475,882 316,476
Pointing Devices . . . . . . . . . . . . . . . . . . . . . . . . . . . . . . . 487,210 506,884 521,083
Keyboards & Combos . . . . . . . . . . . . . . . . . . . . . . . . . . . 426,117 415,314 399,144
Audio-PC & Wearables. . . . . . . . . . . . . . . . . . . . . . . . . . 213,496 250,037 289,313
PC Webcams . . . . . . . . . . . . . . . . . . . . . . . . . . . . . . . . . 96,680 113,791 137,292
Home Control . . . . . . . . . . . . . . . . . . . . . . . . . . . . . . . . . 68,060 67,371 71,641
Profit Maximization . . . . . . . . . . . . . . . . . . . . . . . . . 1,291,563 1,353,397 1,418,473
Retail Strategic Sales(1). . . . . . . . . . . . . . . . . . . . 1,884,721 1,829,279 1,734,949
Non-Strategic . . . . . . . . . . . . . . . . . . . . . . . . . . . 2,725 37,000 86,102
OEM . . . . . . . . . . . . . . . . . . . . . . . . . . . . . . . . . . . . . . 117,462 141,749 141,186
2,004,908 2,008,028 1,962,237
Video Conferencing . . . . . . . . . . . . . . . . . . . . . . . . . . . . . . 109,039 120,685 137,040
$2,113,947 $2,128,713 $2,099,277
(1) Certain products within the retail product families presented in prior years have been reclassified to
conform to the current year presentation. There is no impact over total net retail sales.
Net sales to unaffiliated customers by geographic region for fiscal years 2015, 2014 and 2013 (based
on the customers’ location) were as follows (in thousands):
Years Ended March 31,
2015 2014 2013
Americas . . . . . . . . . . . . . . . . . . . . . . . . . . . . . . . . . . . . . . . . $ 915,478 $ 859,893 $ 808,618
EMEA . . . . . . . . . . . . . . . . . . . . . . . . . . . . . . . . . . . . . . . . . . 710,966 767,017 799,075
Asia Pacific . . . . . . . . . . . . . . . . . . . . . . . . . . . . . . . . . . . . . . 487,503 501,803 491,584
$2,113,947 $2,128,713 $2,099,277
The United States represented 36%, 35% and 33% of net sales for the fiscal years 2015, 2014 and
2013, respectively. No other single country represented more than 10% of net sales during these periods.
Revenues from net sales to customers in Switzerland, the Company’s home domicile, represented 2% of
net sales for each of fiscal years 2015, 2014 and 2013, respectively.
Note 13—Segment Information (Continued)
115
Annual Report Fiscal Year 2015