Logitech 2015 Annual Report Download - page 188
Download and view the complete annual report
Please find page 188 of the 2015 Logitech annual report below. You can navigate through the pages in the report by either clicking on the pages listed below, or by using the keyword search tool below to find specific information within the annual report.-
 1
1 -
2
-
3
-
4
-
5
-
6
-
7
-
8
-
9
-
10
-
11
-
12
-
13
-
14
-
15
-
16
-
17
-
18
-
19
-
20
-
21
-
22
-
23
-
24
-
25
-
26
-
27
-
28
-
29
-
30
-
31
-
32
-
33
-
34
-
35
-
36
-
37
-
38
-
39
-
40
-
41
-
42
-
43
-
44
-
45
-
46
-
47
-
48
-
49
-
50
-
51
-
52
-
53
-
54
-
55
-
56
-
57
-
58
-
59
-
60
-
61
-
62
-
63
-
64
-
65
-
66
-
67
-
68
-
69
-
70
-
71
-
72
-
73
-
74
-
75
-
76
-
77
-
78
-
79
-
80
-
81
-
82
-
83
-
84
-
85
-
86
-
87
-
88
-
89
-
90
-
91
-
92
-
93
-
94
-
95
-
96
-
97
-
98
-
99
-
100
-
101
-
102
-
103
-
104
-
105
-
106
-
107
-
108
-
109
-
110
-
111
-
112
-
113
-
114
-
115
-
116
-
117
-
118
-
119
-
120
-
121
-
122
-
123
-
124
-
125
-
126
-
127
-
128
-
129
-
130
-
131
-
132
-
133
-
134
-
135
-
136
-
137
-
138
-
139
-
140
-
141
-
142
-
143
-
144
-
145
-
146
-
147
-
148
-
149
-
150
-
151
-
152
-
153
-
154
-
155
-
156
-
157
-
158
-
159
-
160
-
161
-
162
-
163
-
164
-
165
-
166
-
167
-
168
-
169
-
170
-
171
-
172
-
173
-
174
-
175
-
176
-
177
-
 178
178 -
 179
179 -
 180
180 -
 181
181 -
 182
182 -
 183
183 -
 184
184 -
 185
185 -
 186
186 -
 187
187 -
 188
188 -
 189
189 -
 190
190 -
 191
191 -
 192
192 -
 193
193 -
 194
194 -
 195
195 -
 196
196 -
 197
197 -
 198
198 -
199
-
200
-
201
-
202
-
203
-
204
-
205
-
206
-
207
-
208
-
209
-
210
-
211
-
212
-
213
-
214
-
215
-
216
-
217
-
218
-
219
-
220
-
221
-
222
-
223
-
224
-
225
-
226
-
227
-
228
-
229
-
230
-
231
-
232
-
233
-
234
-
235
-
236
-
237
-
238
-
239
-
240
-
241
-
242
-
243
-
244
-
245
-
246
-
247
-
248
-
249
-
250
-
251
-
252
 |
 |

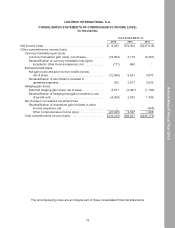
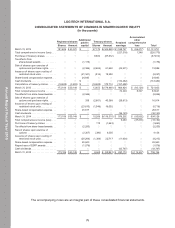
The accompanying notes are an integral part of these consolidated financial statements.
LOGITECH INTERNATIONAL S.A.
CONSOLIDATED STATEMENTS OF OPERATIONS
(In thousands, except per share amounts)
Years Ended March 31,
2015 2014 2013
Net sales . . . . . . . . . . . . . . . . . . . . . . . . . . . . . . . . . . . . . $2,113,947 $2,128,713 $2,099,277
Cost of goods sold . . . . . . . . . . . . . . . . . . . . . . . . . . . . . . 1,339,750 1,400,844 1,389,643
Gross profit . . . . . . . . . . . . . . . . . . . . . . . . . . . . . . . . . 774,197 727,869 709,634
Operating expenses:
Marketing and selling . . . . . . . . . . . . . . . . . . . . . . . . . 378,593 379,747 431,886
Research and development . . . . . . . . . . . . . . . . . . . . 131,012 139,385 155,012
General and administrative . . . . . . . . . . . . . . . . . . . . . 131,446 118,940 114,381
Impairment of goodwill and other assets. . . . . . . . . . . 122,734 — 216,688
Restructuring charges (credits), net . . . . . . . . . . . . . . (4,888) 13,811 43,704
Total operating expenses. . . . . . . . . . . . . . . . . . . . 758,897 651,883 961,671
Operating income (loss) . . . . . . . . . . . . . . . . . . . . . . . . . . 15,300 75,986 (252,037)
Interest income (expense), net . . . . . . . . . . . . . . . . . . . . . 1,225 (397) 907
Other income (expense), net . . . . . . . . . . . . . . . . . . . . . . (2,752) 1,993 (2,198)
Income (loss) before income taxes . . . . . . . . . . . . . . . . . 13,773 77,582 (253,328)
Provision for (benefit from) income taxes. . . . . . . . . . . . . 4,490 3,278 (25,810)
Net income (loss) . . . . . . . . . . . . . . . . . . . . . . . . . . . . $ 9,283 $ 74,304 $ (227,518)
Net income (loss) per share:
Basic . . . . . . . . . . . . . . . . . . . . . . . . . . . . . . . . . . . . . . $ 0.06 $ 0.46 $ (1.44)
Diluted . . . . . . . . . . . . . . . . . . . . . . . . . . . . . . . . . . . . . $ 0.06 $ 0.46 $ (1.44)
Shares used to compute net income (loss) per share :
Basic . . . . . . . . . . . . . . . . . . . . . . . . . . . . . . . . . . . . . . 163,536 160,619 158,468
Diluted . . . . . . . . . . . . . . . . . . . . . . . . . . . . . . . . . . . . . 166,174 162,526 158,468
Cash dividends per share. . . . . . . . . . . . . . . . . . . . . . . . . $ 0.27 $ 0.22 $ 0.85
72
Annual Report Fiscal Year 2015