Logitech 2015 Annual Report Download - page 232
Download and view the complete annual report
Please find page 232 of the 2015 Logitech annual report below. You can navigate through the pages in the report by either clicking on the pages listed below, or by using the keyword search tool below to find specific information within the annual report.-
 1
1 -
2
-
3
-
4
-
5
-
6
-
7
-
8
-
9
-
10
-
11
-
12
-
13
-
14
-
15
-
16
-
17
-
18
-
19
-
20
-
21
-
22
-
23
-
24
-
25
-
26
-
27
-
28
-
29
-
30
-
31
-
32
-
33
-
34
-
35
-
36
-
37
-
38
-
39
-
40
-
41
-
42
-
43
-
44
-
45
-
46
-
47
-
48
-
49
-
50
-
51
-
52
-
53
-
54
-
55
-
56
-
57
-
58
-
59
-
60
-
61
-
62
-
63
-
64
-
65
-
66
-
67
-
68
-
69
-
70
-
71
-
72
-
73
-
74
-
75
-
76
-
77
-
78
-
79
-
80
-
81
-
82
-
83
-
84
-
85
-
86
-
87
-
88
-
89
-
90
-
91
-
92
-
93
-
94
-
95
-
96
-
97
-
98
-
99
-
100
-
101
-
102
-
103
-
104
-
105
-
106
-
107
-
108
-
109
-
110
-
111
-
112
-
113
-
114
-
115
-
116
-
117
-
118
-
119
-
120
-
121
-
122
-
123
-
124
-
125
-
126
-
127
-
128
-
129
-
130
-
131
-
132
-
133
-
134
-
135
-
136
-
137
-
138
-
139
-
140
-
141
-
142
-
143
-
144
-
145
-
146
-
147
-
148
-
149
-
150
-
151
-
152
-
153
-
154
-
155
-
156
-
157
-
158
-
159
-
160
-
161
-
162
-
163
-
164
-
165
-
166
-
167
-
168
-
169
-
170
-
171
-
172
-
173
-
174
-
175
-
176
-
177
-
178
-
179
-
180
-
181
-
182
-
183
-
184
-
185
-
186
-
187
-
188
-
189
-
190
-
191
-
192
-
193
-
194
-
195
-
196
-
197
-
198
-
199
-
200
-
201
-
202
-
203
-
204
-
205
-
206
-
207
-
208
-
209
-
210
-
211
-
212
-
213
-
214
-
215
-
216
-
217
-
218
-
219
-
220
-
221
-
 222
222 -
 223
223 -
 224
224 -
 225
225 -
 226
226 -
 227
227 -
 228
228 -
 229
229 -
 230
230 -
 231
231 -
 232
232 -
 233
233 -
 234
234 -
 235
235 -
 236
236 -
 237
237 -
 238
238 -
 239
239 -
 240
240 -
 241
241 -
 242
242 -
243
-
244
-
245
-
246
-
247
-
248
-
249
-
250
-
251
-
252
 |
 |

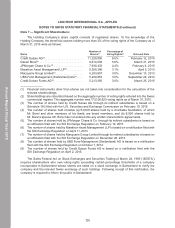
LOGITECH INTERNATIONAL S.A.
NOTES TO CONSOLIDATED FINANCIAL STATEMENTS (Continued)
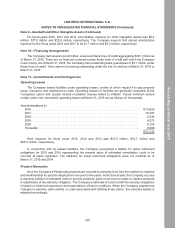
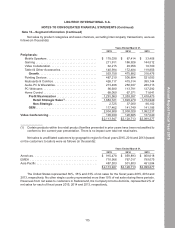
Geographic long-lived assets information, primarily fixed assets, are reported below based on the
location of the asset (in thousands):
March 31,
2015 2014
Americas . . . . . . . . . . . . . . . . . . . . . . . . . . . . . . . . . . . . . . . . . . . . . . . . . . . . . . . . . $48,527 $45,166
EMEA . . . . . . . . . . . . . . . . . . . . . . . . . . . . . . . . . . . . . . . . . . . . . . . . . . . . . . . . . . . 3,584 5,154
Asia Pacific . . . . . . . . . . . . . . . . . . . . . . . . . . . . . . . . . . . . . . . . . . . . . . . . . . . . . . . 39,482 38,071
$91,593 $88,391
Long-lived assets in the United States and China were $48.3 million and $34.0 million at March 31,
2015, respectively, and $44.9 million and $31.9 million at March 31, 2014, respectively. No other countries
represented more than 10% of the Company’s total consolidated long-lived assets at March 31, 2015 or
2014. Long-lived assets in Switzerland, the Company’s home domicile, were $1.5 million and $1.6 million
at March 31, 2015 and 2014, respectively.
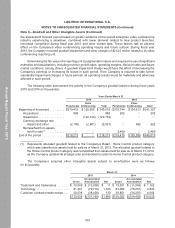
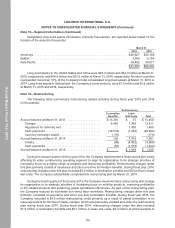
Note 14—Restructuring
The following table summarizes restructuring related activities during fiscal year 2015 and 2014
(in thousands):
Restructuring
Termination
Benefits
Lease
Exit Costs Total
Accrual balance at March 31, 2013 . . . . . . . . . . . . . . . . . . . . . $ 13,383 $ 75 $ 13,458
Charges. . . . . . . . . . . . . . . . . . . . . . . . . . . . . . . . . . . . . . . . 6,463 7,348 13,811
Adjustment for deferred rent . . . . . . . . . . . . . . . . . . . . . . . . — 1,450 1,450
Cash payments . . . . . . . . . . . . . . . . . . . . . . . . . . . . . . . . . . (19,534) (1,454) (20,988)
Currency exchange impact . . . . . . . . . . . . . . . . . . . . . . . . . (170) — (170)
Accrual balance at March 31, 2014 . . . . . . . . . . . . . . . . . . . . . 142 7,419 7,561
Credits. . . . . . . . . . . . . . . . . . . . . . . . . . . . . . . . . . . . . . . . . (86) (4,802) (4,888)
Cash payments . . . . . . . . . . . . . . . . . . . . . . . . . . . . . . . . . . (56) (1,578) (1,634)
Accrual balance at March 31, 2015 . . . . . . . . . . . . . . . . . . . . . $ — $ 1,039 $ 1,039
During the second quarter of fiscal year 2014, the Company implemented a restructuring plan solely
affecting its video conferencing operating segment to align its organization to its strategic priorities of
increasing focus on a tighter range of products and improving profitability. Restructuring charges under
this plan primarily consist of severance and other one-time termination benefits. During fiscal year 2014,
restructuring charges under this plan included $5.0 million in termination benefits and $0.6 million in lease
exit costs. The Company substantially completed this restructuring plan by March 31, 2014.
During the fourth quarter of fiscal year 2013, the Company implemented a restructuring plan to align
its organization to its strategic priorities of increasing focus on mobility products, improving profitability
in PC-related products and enhancing global operational efficiencies. As part of this restructuring plan,
the Company reduced its worldwide non-direct labor workforce. Restructuring charges under this plan
primarily consisted of severance and other one-time termination benefits. During fiscal year 2015, the
Company recorded a $4.9 million restructuring credit primarily as a result of partial termination of its
lease agreement for the Silicon Valley campus, which was previously vacated and under the restructuring
plan during fiscal year 2014. During fiscal year 2014, restructuring charges under this plan included
$1.5 million in termination benefits and $6.7 million in lease exit costs, $5.4 million of which pertains to
Note 13—Segment Information (Continued)
116
Annual Report Fiscal Year 2015