Logitech 2015 Annual Report Download - page 130
Download and view the complete annual report
Please find page 130 of the 2015 Logitech annual report below. You can navigate through the pages in the report by either clicking on the pages listed below, or by using the keyword search tool below to find specific information within the annual report.-
 1
1 -
2
-
3
-
4
-
5
-
6
-
7
-
8
-
9
-
10
-
11
-
12
-
13
-
14
-
15
-
16
-
17
-
18
-
19
-
20
-
21
-
22
-
23
-
24
-
25
-
26
-
27
-
28
-
29
-
30
-
31
-
32
-
33
-
34
-
35
-
36
-
37
-
38
-
39
-
40
-
41
-
42
-
43
-
44
-
45
-
46
-
47
-
48
-
49
-
50
-
51
-
52
-
53
-
54
-
55
-
56
-
57
-
58
-
59
-
60
-
61
-
62
-
63
-
64
-
65
-
66
-
67
-
68
-
69
-
70
-
71
-
72
-
73
-
74
-
75
-
76
-
77
-
78
-
79
-
80
-
81
-
82
-
83
-
84
-
85
-
86
-
87
-
88
-
89
-
90
-
91
-
92
-
93
-
94
-
95
-
96
-
97
-
98
-
99
-
100
-
101
-
102
-
103
-
104
-
105
-
106
-
107
-
108
-
109
-
110
-
111
-
112
-
113
-
114
-
115
-
116
-
117
-
118
-
119
-
 120
120 -
 121
121 -
 122
122 -
 123
123 -
 124
124 -
 125
125 -
 126
126 -
 127
127 -
 128
128 -
 129
129 -
 130
130 -
 131
131 -
 132
132 -
 133
133 -
 134
134 -
 135
135 -
 136
136 -
 137
137 -
 138
138 -
 139
139 -
 140
140 -
141
-
142
-
143
-
144
-
145
-
146
-
147
-
148
-
149
-
150
-
151
-
152
-
153
-
154
-
155
-
156
-
157
-
158
-
159
-
160
-
161
-
162
-
163
-
164
-
165
-
166
-
167
-
168
-
169
-
170
-
171
-
172
-
173
-
174
-
175
-
176
-
177
-
178
-
179
-
180
-
181
-
182
-
183
-
184
-
185
-
186
-
187
-
188
-
189
-
190
-
191
-
192
-
193
-
194
-
195
-
196
-
197
-
198
-
199
-
200
-
201
-
202
-
203
-
204
-
205
-
206
-
207
-
208
-
209
-
210
-
211
-
212
-
213
-
214
-
215
-
216
-
217
-
218
-
219
-
220
-
221
-
222
-
223
-
224
-
225
-
226
-
227
-
228
-
229
-
230
-
231
-
232
-
233
-
234
-
235
-
236
-
237
-
238
-
239
-
240
-
241
-
242
-
243
-
244
-
245
-
246
-
247
-
248
-
249
-
250
-
251
-
252
 |
 |

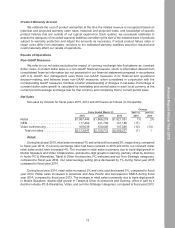
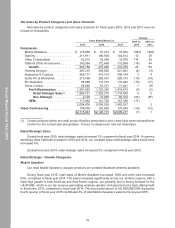
OEM:
During fiscal year 2015, OEM sales and units sold decreased 17% and 25%, respectively, compared
to fiscal year 2014. If currency exchange rates had been constant in 2015 and 2014, our constant dollar
OEM net sales would have decreased 17%. The decline was primarily due to the continued weakness in
global PCs market and loss of volume shares from certain PC manufactures. Given our heightened focus
on our growing Retail Strategic business, we plan to exit the OEM business.
During fiscal year 2014, OEM sales and units sold remained flat, compared to fiscal year 2013.
Video conferencing:
During fiscal year 2015, video conferencing net sales decreased 10%, compared to fiscal year 2014.
If currency exchange rates had been constant in 2015 and 2014, our constant dollar video conferencing
net sales would have decreased 10%. Lifesize is in the process of transitioning its product portfolio to the
recently announced Lifesize Cloud, a software-as-a-service (SaaS) offering that provides an affordable,
simple and scalable video conferencing solution with little to no need for IT involvement. While sales
of the Cloud offering are growing rapidly, they are not yet large enough to offset the combination of the
short-term portfolio transition and soft market conditions for video conferencing infrastructure. To align
our refocus on Lifesize Cloud offering and transition from Lifesize legacy business, we announced a
restructuring plan subsequently in April 2015.
During fiscal year 2014, video conferencing net sales decreased 12%, compared to fiscal year 2013.
The decrease primarily resulted from the combination of a changing industry landscape caused by a
shift to less expensive, Cloud-based video conferencing solutions, an evolving Lifesize product line and
challenges in execution.
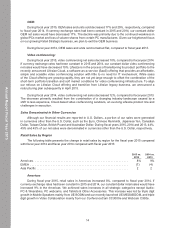
Sales Denominated in Other Currencies
Although our financial results are reported in U.S. Dollars, a portion of our sales were generated
in currencies other than the U.S. Dollar, such as the Euro, Chinese Renminbi, Japanese Yen, Canadian
Dollar, Taiwan Dollar, British Pound and Australian Dollar. During fiscal years 2015, 2014 and 2013, 44%,
45% and 45% of our net sales were denominated in currencies other than the U.S. Dollar, respectively.
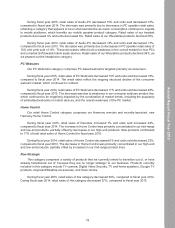
Retail Sales by Region
The following table presents the change in retail sales by region for the fiscal year 2015 compared
with fiscal year 2014 and fiscal year 2014 compared with fiscal year 2013:
2015 vs.
2014
2014 vs.
2013
Americas . . . . . . . . . . . . . . . . . . . . . . . . . . . . . . . . . . . . . . . . . . . . . . . . . . . . . . . . . . . 8% 9%
EMEA . . . . . . . . . . . . . . . . . . . . . . . . . . . . . . . . . . . . . . . . . . . . . . . . . . . . . . . . . . . . . (7) (4)
Asia Pacific . . . . . . . . . . . . . . . . . . . . . . . . . . . . . . . . . . . . . . . . . . . . . . . . . . . . . . . . . 2 2
Americas
During fiscal year 2015, retail sales in Americas increased 8%, compared to fiscal year 2014. If
currency exchange rates had been constant in 2015 and 2014, our constant dollar retail sales would have
increased 9% in the Americas. We achieved sales increases in all strategic categories except Audio-
PC & Wearables, PC webcams, and Tablets & Other Accessories. This increase was led by triple digit
growth in Mobile Speakers mainly from UE BOOM and our recently launched UE MEGABOOM, and triple
digit growth in Video Collaboration mainly from our ConferenceCam CC3000e and Webcam C930e.
14
Annual Report Fiscal Year 2015