Logitech 2015 Annual Report Download - page 144
Download and view the complete annual report
Please find page 144 of the 2015 Logitech annual report below. You can navigate through the pages in the report by either clicking on the pages listed below, or by using the keyword search tool below to find specific information within the annual report.-
 1
1 -
2
-
3
-
4
-
5
-
6
-
7
-
8
-
9
-
10
-
11
-
12
-
13
-
14
-
15
-
16
-
17
-
18
-
19
-
20
-
21
-
22
-
23
-
24
-
25
-
26
-
27
-
28
-
29
-
30
-
31
-
32
-
33
-
34
-
35
-
36
-
37
-
38
-
39
-
40
-
41
-
42
-
43
-
44
-
45
-
46
-
47
-
48
-
49
-
50
-
51
-
52
-
53
-
54
-
55
-
56
-
57
-
58
-
59
-
60
-
61
-
62
-
63
-
64
-
65
-
66
-
67
-
68
-
69
-
70
-
71
-
72
-
73
-
74
-
75
-
76
-
77
-
78
-
79
-
80
-
81
-
82
-
83
-
84
-
85
-
86
-
87
-
88
-
89
-
90
-
91
-
92
-
93
-
94
-
95
-
96
-
97
-
98
-
99
-
100
-
101
-
102
-
103
-
104
-
105
-
106
-
107
-
108
-
109
-
110
-
111
-
112
-
113
-
114
-
115
-
116
-
117
-
118
-
119
-
120
-
121
-
122
-
123
-
124
-
125
-
126
-
127
-
128
-
129
-
130
-
131
-
132
-
133
-
 134
134 -
 135
135 -
 136
136 -
 137
137 -
 138
138 -
 139
139 -
 140
140 -
 141
141 -
 142
142 -
 143
143 -
 144
144 -
 145
145 -
 146
146 -
 147
147 -
 148
148 -
 149
149 -
 150
150 -
 151
151 -
 152
152 -
 153
153 -
 154
154 -
155
-
156
-
157
-
158
-
159
-
160
-
161
-
162
-
163
-
164
-
165
-
166
-
167
-
168
-
169
-
170
-
171
-
172
-
173
-
174
-
175
-
176
-
177
-
178
-
179
-
180
-
181
-
182
-
183
-
184
-
185
-
186
-
187
-
188
-
189
-
190
-
191
-
192
-
193
-
194
-
195
-
196
-
197
-
198
-
199
-
200
-
201
-
202
-
203
-
204
-
205
-
206
-
207
-
208
-
209
-
210
-
211
-
212
-
213
-
214
-
215
-
216
-
217
-
218
-
219
-
220
-
221
-
222
-
223
-
224
-
225
-
226
-
227
-
228
-
229
-
230
-
231
-
232
-
233
-
234
-
235
-
236
-
237
-
238
-
239
-
240
-
241
-
242
-
243
-
244
-
245
-
246
-
247
-
248
-
249
-
250
-
251
-
252
 |
 |

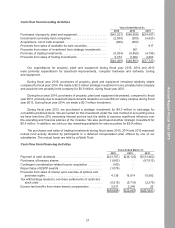
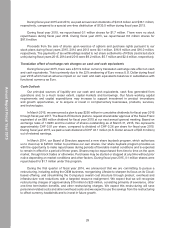
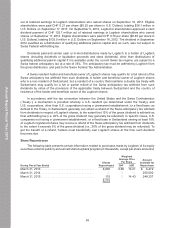
During fiscal year 2015 and 2014, we paid annual cash dividends of $43.8 million and $36.1 million,
respectively, compared to a special one-time distribution of $133.5 million during fiscal year 2013.
During fiscal year 2015, we repurchased 0.1 million shares for $1.7 million. There were no stock
repurchases during fiscal year 2014. During fiscal year 2013, we repurchased 8.6 million shares for
$87.8 million.
Proceeds from the sale of shares upon exercise of options and purchase rights pursuant to our
stock plans during fiscal years 2015, 2014 and 2013 were $4.1 million, $16.9 million and $16.0 million,
respectively. The payments of tax withholdings related to net share settlements of RSUs (restricted stock
units) during fiscal years 2015, 2014 and 2013 were $9.2 million, $5.7 million and $2.4 million, respectively.
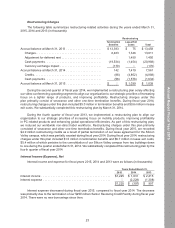
Translation effect of exchange rate changes on cash and cash equivalents
During fiscal year 2015, there was a $13.9 million currency translation exchange rate effect on cash
and cash equivalents. This is primarily due to the 22% weakening of Euro versus U.S. Dollar during fiscal
year 2015 which had an adverse impact on our cash and cash equivalents balances in subsidiaries with
functional currency as Euro.
Cash Outlook
Our principal sources of liquidity are our cash and cash equivalents, cash flow generated from
operations and, to a much lesser extent, capital markets and borrowings. Our future working capital
requirements and capital expenditures may increase to support investment in product innovations
and growth opportunities, or to acquire or invest in complementary businesses, products, services,
and technologies.
In March 2015, we announced a plan to pay $250 million in cumulative dividends for fiscal year 2015
through fiscal year 2017. The Board of Directors plans to request shareholder approval of the Swiss Franc
equivalent of an $85 million dividend for fiscal year 2015 at our next annual general meeting. Based on
exchange rates of 1.0283 and the number of shares outstanding as of March 31, 2015, this represents
approximately CHF 0.51 per share, compared to dividend of CHF 0.26 per share for fiscal year 2015.
During fiscal year 2015, we paid a cash dividend of CHF 43.1 million (U.S. Dollar amount of $43.8 million)
out of retained earnings.
In March 2014, our Board of Directors approved a new share buyback program, which authorizes
us to invest up to $250.0 million to purchase our own shares. Our share buyback program provides us
with the opportunity to make repurchases during periods of favorable market conditions and is expected
to remain in effect for a period of three years. Shares may be repurchased from time to time on the open
market, through block trades or otherwise. Purchases may be started or stopped at any time without prior
notice depending on market conditions and other factors. During fiscal year 2015, 0.1 million shares were
repurchased for $1.7 million under this program.
During the first quarter of fiscal year 2016, we announced that we are committing to pursue a
restructuring, including exiting the OEM business, reorganizing Lifesize to sharpen its focus on its Cloud-
based offering, and streamlining the Company’s overall cost structure through product, overhead and
infrastructure cost reductions with a targeted resource realignment. We expect that we will recognize
restructuring charges of approximately $15 million to $20 million, consisting primarily of severance, other
one-time termination benefits, and other restructuring charges. We expect this restructuring will save
personnel-related costs and other overhead costs and we expect to use the savings from the restructuring
to offset currency headwinds and to invest in future growth.
28
Annual Report Fiscal Year 2015