Logitech 2015 Annual Report Download - page 143
Download and view the complete annual report
Please find page 143 of the 2015 Logitech annual report below. You can navigate through the pages in the report by either clicking on the pages listed below, or by using the keyword search tool below to find specific information within the annual report.-
 1
1 -
2
-
3
-
4
-
5
-
6
-
7
-
8
-
9
-
10
-
11
-
12
-
13
-
14
-
15
-
16
-
17
-
18
-
19
-
20
-
21
-
22
-
23
-
24
-
25
-
26
-
27
-
28
-
29
-
30
-
31
-
32
-
33
-
34
-
35
-
36
-
37
-
38
-
39
-
40
-
41
-
42
-
43
-
44
-
45
-
46
-
47
-
48
-
49
-
50
-
51
-
52
-
53
-
54
-
55
-
56
-
57
-
58
-
59
-
60
-
61
-
62
-
63
-
64
-
65
-
66
-
67
-
68
-
69
-
70
-
71
-
72
-
73
-
74
-
75
-
76
-
77
-
78
-
79
-
80
-
81
-
82
-
83
-
84
-
85
-
86
-
87
-
88
-
89
-
90
-
91
-
92
-
93
-
94
-
95
-
96
-
97
-
98
-
99
-
100
-
101
-
102
-
103
-
104
-
105
-
106
-
107
-
108
-
109
-
110
-
111
-
112
-
113
-
114
-
115
-
116
-
117
-
118
-
119
-
120
-
121
-
122
-
123
-
124
-
125
-
126
-
127
-
128
-
129
-
130
-
131
-
132
-
 133
133 -
 134
134 -
 135
135 -
 136
136 -
 137
137 -
 138
138 -
 139
139 -
 140
140 -
 141
141 -
 142
142 -
 143
143 -
 144
144 -
 145
145 -
 146
146 -
 147
147 -
 148
148 -
 149
149 -
 150
150 -
 151
151 -
 152
152 -
 153
153 -
154
-
155
-
156
-
157
-
158
-
159
-
160
-
161
-
162
-
163
-
164
-
165
-
166
-
167
-
168
-
169
-
170
-
171
-
172
-
173
-
174
-
175
-
176
-
177
-
178
-
179
-
180
-
181
-
182
-
183
-
184
-
185
-
186
-
187
-
188
-
189
-
190
-
191
-
192
-
193
-
194
-
195
-
196
-
197
-
198
-
199
-
200
-
201
-
202
-
203
-
204
-
205
-
206
-
207
-
208
-
209
-
210
-
211
-
212
-
213
-
214
-
215
-
216
-
217
-
218
-
219
-
220
-
221
-
222
-
223
-
224
-
225
-
226
-
227
-
228
-
229
-
230
-
231
-
232
-
233
-
234
-
235
-
236
-
237
-
238
-
239
-
240
-
241
-
242
-
243
-
244
-
245
-
246
-
247
-
248
-
249
-
250
-
251
-
252
 |
 |

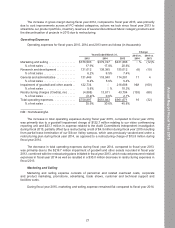
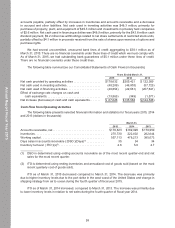
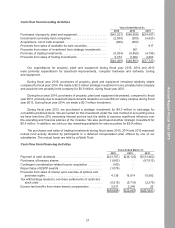
Cash Flow from Investing Activities
Years Ended March 31,
2015 2014 2013
Purchases of property, plant and equipment. . . . . . . . . . . . . . . . . . . $(45,253) $(46,658) $(54,487)
Investment in privately held companies . . . . . . . . . . . . . . . . . . . . . . (2,550) (300) (4,420)
Acquisitions, net of cash acquired . . . . . . . . . . . . . . . . . . . . . . . . . . . (926) (650) —
Proceeds from sales of available-for-sale securities . . . . . . . . . . . . . — — 917
Proceeds from return of investment from strategic investments . . . . — 261 —
Purchase of trading investments . . . . . . . . . . . . . . . . . . . . . . . . . . . . (5,034) (8,450) (4,196)
Proceeds from sales of trading investments . . . . . . . . . . . . . . . . . . . 5,474 8,994 4,463
$(48,289) $(46,803) $(57,723)
Our expenditures for property, plant and equipment during fiscal year 2015, 2014 and 2013
were primarily expenditures for leasehold improvements, computer hardware and software, tooling
and equipment.
During fiscal year 2015, purchases of property, plant and equipment remained relatively stable
compared to fiscal year 2014. We made a $2.5 million strategic investment in one privately held company
and acquired one privately held company for $0.9 million, during fiscal year 2015.
During fiscal year 2014, purchases of property, plant and equipment decreased, compared to fiscal
year 2013, primarily due to leasehold improvements related to our new Silicon Valley campus during fiscal
year 2013. During fiscal year 2014, we made a $0.7 million investment.
During fiscal year 2013, we purchased a strategic investment for $4.0 million in exchange for
convertible preferred stock. We accounted for this investment under the cost method of accounting since
we have less than 20% ownership interest and we lack the ability to exercise significant influence over
the operating and financial policies of the investee. We also purchased another strategic investment for
$0.4 million. In addition, we sold our two remaining available-for-sale securities for $0.9 million.
The purchases and sales of trading investments during fiscal years 2015, 2014 and 2013 represent
mutual fund activity directed by participants in a deferred compensation plan offered by one of our
subsidiaries. The mutual funds are held by a Rabbi Trust.
Cash Flow from Financing Activities
Years Ended March 31,
2015 2014 2013
Payment of cash dividends . . . . . . . . . . . . . . . . . . . . . . . . . . . . . $(43,767) $(36,123) $(133,462)
Purchases of treasury shares . . . . . . . . . . . . . . . . . . . . . . . . . . . (1,663) — (87,812)
Contingent consideration related to prior acquisition . . . . . . . . . (100) — —
Repurchase of ESPP awards . . . . . . . . . . . . . . . . . . . . . . . . . . . (1,078) — —
Proceeds from sales of shares upon exercise of options and
purchase rights . . . . . . . . . . . . . . . . . . . . . . . . . . . . . . . . . . . . 4,138 16,914 15,982
Tax withholdings related to net share settlements of restricted
stock units . . . . . . . . . . . . . . . . . . . . . . . . . . . . . . . . . . . . . . . (9,215) (5,718) (2,375)
Excess tax benefits from share-based compensation . . . . . . . . 2,831 2,246 26
$(48,854) $(22,681) $(207,641)
27
Annual Report Fiscal Year 2015