Logitech 2015 Annual Report Download - page 154
Download and view the complete annual report
Please find page 154 of the 2015 Logitech annual report below. You can navigate through the pages in the report by either clicking on the pages listed below, or by using the keyword search tool below to find specific information within the annual report.-
 1
1 -
2
-
3
-
4
-
5
-
6
-
7
-
8
-
9
-
10
-
11
-
12
-
13
-
14
-
15
-
16
-
17
-
18
-
19
-
20
-
21
-
22
-
23
-
24
-
25
-
26
-
27
-
28
-
29
-
30
-
31
-
32
-
33
-
34
-
35
-
36
-
37
-
38
-
39
-
40
-
41
-
42
-
43
-
44
-
45
-
46
-
47
-
48
-
49
-
50
-
51
-
52
-
53
-
54
-
55
-
56
-
57
-
58
-
59
-
60
-
61
-
62
-
63
-
64
-
65
-
66
-
67
-
68
-
69
-
70
-
71
-
72
-
73
-
74
-
75
-
76
-
77
-
78
-
79
-
80
-
81
-
82
-
83
-
84
-
85
-
86
-
87
-
88
-
89
-
90
-
91
-
92
-
93
-
94
-
95
-
96
-
97
-
98
-
99
-
100
-
101
-
102
-
103
-
104
-
105
-
106
-
107
-
108
-
109
-
110
-
111
-
112
-
113
-
114
-
115
-
116
-
117
-
118
-
119
-
120
-
121
-
122
-
123
-
124
-
125
-
126
-
127
-
128
-
129
-
130
-
131
-
132
-
133
-
134
-
135
-
136
-
137
-
138
-
139
-
140
-
141
-
142
-
143
-
 144
144 -
 145
145 -
 146
146 -
 147
147 -
 148
148 -
 149
149 -
 150
150 -
 151
151 -
 152
152 -
 153
153 -
 154
154 -
 155
155 -
 156
156 -
 157
157 -
 158
158 -
 159
159 -
 160
160 -
 161
161 -
 162
162 -
 163
163 -
 164
164 -
165
-
166
-
167
-
168
-
169
-
170
-
171
-
172
-
173
-
174
-
175
-
176
-
177
-
178
-
179
-
180
-
181
-
182
-
183
-
184
-
185
-
186
-
187
-
188
-
189
-
190
-
191
-
192
-
193
-
194
-
195
-
196
-
197
-
198
-
199
-
200
-
201
-
202
-
203
-
204
-
205
-
206
-
207
-
208
-
209
-
210
-
211
-
212
-
213
-
214
-
215
-
216
-
217
-
218
-
219
-
220
-
221
-
222
-
223
-
224
-
225
-
226
-
227
-
228
-
229
-
230
-
231
-
232
-
233
-
234
-
235
-
236
-
237
-
238
-
239
-
240
-
241
-
242
-
243
-
244
-
245
-
246
-
247
-
248
-
249
-
250
-
251
-
252
 |
 |

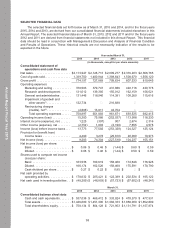
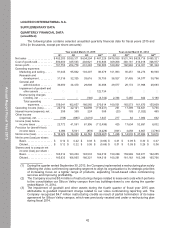
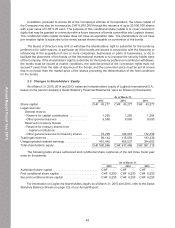
SELECTED FINANCIAL DATA
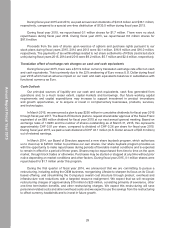
The selected financial data set forth below as of March 31, 2015 and 2014, and for the fiscal years
2015, 2014 and 2013, are derived from our consolidated financial statements included elsewhere in this
Annual Report. The selected financial data as of March 31, 2013, 2012 and 2011 and for the fiscal years
2012 and 2011 are derived from financial statements not included in this Annual Report. This financial
data should be read in conjunction with Management’s Discussion and Analysis of Financial Condition
and Results of Operations. These historical results are not necessarily indicative of the results to be
expected in the future.
Year ended March 31,
2015 2014 2013 2012 2011
(in thousands, except for per share amounts)
Consolidated statement of
operations and cash flow data
Net sales . . . . . . . . . . . . . . . . . . . . . . . $2,113,947 $2,128,713 $2,099,277 $2,316,203 $2,366,765
Cost of goods sold . . . . . . . . . . . . . . . . 1,339,750 1,400,844 1,389,643 1,508,670 1,556,120
Gross profit . . . . . . . . . . . . . . . . . . . . . 774,197 727,869 709,634 807,533 810,645
Operating expenses:
Marketing and selling . . . . . . . . . . . 378,593 379,747 431,886 422,116 420,778
Research and development . . . . . . 131,012 139,385 155,012 162,159 156,021
General and administrative . . . . . . . 131,446 118,940 114,381 109,260 115,616
Impairment of goodwill and
other assets(1) . . . . . . . . . . . . . . . 122,734 — 216,688 — —
Restructuring charges
(credits), net(2) . . . . . . . . . . . . . . . (4,888) 13,811 43,704 — —
Total operating expenses. . . . . . 758,897 651,883 961,671 693,535 692,415
Operating income (loss) . . . . . . . . . . . 15,300 75,986 (252,037) 113,998 118,230
Interest income (expense), net . . . . . . 1,225 (397) 907 2,674 2,316
Other income (expense), net . . . . . . . . (2,752) 1,993 (2,198) 7,655 4,578
Income (loss) before income taxes . . . 13,773 77,582 (253,328) 124,327 125,124
Provision for (benefit from)
income taxes . . . . . . . . . . . . . . . . . 4,490 3,278 (25,810) 20,090 19,973
Net income (loss) . . . . . . . . . . . . . . . . . 9,283 74,304 (227,518) 104,237 105,151
Net income (loss) per share:
Basic . . . . . . . . . . . . . . . . . . . . . . . . $ 0.06 $ 0.46 $ (1.44) $ 0.60 $ 0.59
Diluted . . . . . . . . . . . . . . . . . . . . . . . $ 0.06 $ 0.46 $ (1.44) $ 0.59 $ 0.59
Shares used to compute net income
(loss) per share:
Basic . . . . . . . . . . . . . . . . . . . . . . . . 163,536 160,619 158,468 174,648 176,928
Diluted . . . . . . . . . . . . . . . . . . . . . . . 166,174 162,526 158,468 175,591 178,790
Cash dividend per share . . . . . . . . . $ 0.27 $ 0.22 $ 0.85 $ — $ —
Net cash provided by
operating activities . . . . . . . . . . . . . $ 178,632 $ 205,421 $ 122,389 $ 202,534 $ 165,122
Net cash used in investing activities . . $ (48,289) $ (46,803) $ (57,723) $ (57,602) $ (48,241)
March 31,
2015 2014 2013 2012 2011
Consolidated balance sheet data
Cash and cash equivalents. . . . . . . $ 537,038 $ 469,412 $ 333,824 $ 478,370 $ 477,931
Total assets . . . . . . . . . . . . . . . . . . . $1,426,680 $1,451,390 $1,382,333 $1,858,009 $1,852,899
Total shareholders’ equity . . . . . . . . $ 758,134 $ 804,128 $ 721,953 $1,131,791 $1,157,874
38
Annual Report Fiscal Year 2015