Logitech 2015 Annual Report Download - page 158
Download and view the complete annual report
Please find page 158 of the 2015 Logitech annual report below. You can navigate through the pages in the report by either clicking on the pages listed below, or by using the keyword search tool below to find specific information within the annual report.
LOGITECH INTERNATIONAL S.A.
SUPPLEMENTARY DATA
QUARTERLY FINANCIAL DATA
(unaudited)
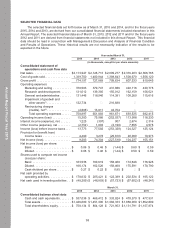
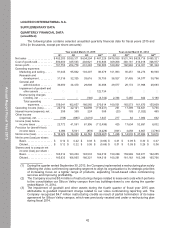
The following table contains selected unaudited quarterly financial data for fiscal years 2015 and
2014 (in thousands, except per share amounts):
Year ended March 31, 2015 Year ended March 31, 2014
Q1 Q2 Q3 Q4(3) Q1 Q2(1) Q3 Q4(2)
Net sales . . . . . . . . . . . . . . . . . $482,203 $ 530,311 $ 634,204 $ 467,229 $ 478,530 $ 531,143 $628,719 $ 490,321
Cost of goods sold . . . . . . . . . . 300,450 325,533 402,921 310,846 309,268 348,181 414,418 328,977
Gross profit. . . . . . . . . . . . . . . . 181,753 204,778 231,283 156,383 169,262 182,962 214,301 161,344
Operating expenses:
Marketing and selling . . . . . 91,045 95,862 103,307 88,379 101,093 93,451 94,273 90,930
Research and
development . . . . . . . . . 31,316 32,325 33,616 33,755 36,527 37,485 34,577 30,796
General and
administrative . . . . . . . . 36,680 34,470 29,808 30,488 29,077 29,172 31,998 28,693
Impairment of goodwill and
other assets . . . . . . . . . — — — 122,734 — — — —
Restructuring charges
(credits), net . . . . . . . . . — — (146) (4,742) 2,334 5,465 822 5,190
Total operating
expenses. . . . . . . . . 159,041 162,657 166,585 270,614 169,031 165,573 161,670 155,609
Operating income (loss). . . . . . 22,712 42,121 64,698 (114,231) 231 17,389 52,631 5,735
Interest income (expense), net. . 258 355 224 388 (23) 183 (1,022) 465
Other income
(expense), net. . . . . . . . . . . (198) (885) (3,016) 1,347 217 62 1,082 632
Income (loss) before
income taxes . . . . . . . . . . . 22,772 41,591 61,906 (112,496) 425 17,634 52,691 6,832
Provision for (benefit from)
income taxes . . . . . . . . . . . 3,096 5,501 (878) (3,229) (801) 3,058 4,807 (3,786)
Net income (loss) . . . . . . . . . . . $ 19,676 $ 36,090 $ 62,784 $(109,267) $ 1,226 $ 14,576 $ 47,884 $ 10,618
Net income (loss) per share:
Basic. . . . . . . . . . . . . . . . . . $ 0.12 $ 0.22 $ 0.38 $ (0.66) $ 0.01 $ 0.09 $ 0.30 $ 0.07
Diluted. . . . . . . . . . . . . . . . . $ 0.12 $ 0.22 $ 0.38 $ (0.66) $ 0.01 $ 0.09 $ 0.29 $ 0.06
Shares used to compute net
income (loss) per share :
Basic. . . . . . . . . . . . . . . . . . 163,012 163,230 163,533 164,319 159,298 159,969 160,871 162,255
Diluted. . . . . . . . . . . . . . . . . 165,833 166,065 166,321 164,319 160,281 161,183 163,388 165,766
(1) During the quarter ended September 30, 2013, the Company implemented a restructuring plan solely
affecting the video conferencing operating segment to align its organization to its strategic priorities
of increasing focus on a tighter range of products, expanding Cloud-based video conferencing
services and improving profitability.
(2) The Company incurred $5.4 million of restructuring charges related to lease exit costs which pertains
to the consolidation our Silicon Valley campus from two buildings down to one during the quarter
ended March 31, 2014.
(3) The impairment of goodwill and other assets during the fourth quarter of fiscal year 2015 was
attributable to goodwill impairment charge related to our video conferencing reporting unit. The
Company recognized $4.7 million restructuring credits as result of partial termination of its lease
agreement for Silicon Valley campus, which was previously vacated and under a restructuring plan
during fiscal 2014.
42
Annual Report Fiscal Year 2015


