Logitech 2015 Annual Report Download - page 153
Download and view the complete annual report
Please find page 153 of the 2015 Logitech annual report below. You can navigate through the pages in the report by either clicking on the pages listed below, or by using the keyword search tool below to find specific information within the annual report.-
 1
1 -
2
-
3
-
4
-
5
-
6
-
7
-
8
-
9
-
10
-
11
-
12
-
13
-
14
-
15
-
16
-
17
-
18
-
19
-
20
-
21
-
22
-
23
-
24
-
25
-
26
-
27
-
28
-
29
-
30
-
31
-
32
-
33
-
34
-
35
-
36
-
37
-
38
-
39
-
40
-
41
-
42
-
43
-
44
-
45
-
46
-
47
-
48
-
49
-
50
-
51
-
52
-
53
-
54
-
55
-
56
-
57
-
58
-
59
-
60
-
61
-
62
-
63
-
64
-
65
-
66
-
67
-
68
-
69
-
70
-
71
-
72
-
73
-
74
-
75
-
76
-
77
-
78
-
79
-
80
-
81
-
82
-
83
-
84
-
85
-
86
-
87
-
88
-
89
-
90
-
91
-
92
-
93
-
94
-
95
-
96
-
97
-
98
-
99
-
100
-
101
-
102
-
103
-
104
-
105
-
106
-
107
-
108
-
109
-
110
-
111
-
112
-
113
-
114
-
115
-
116
-
117
-
118
-
119
-
120
-
121
-
122
-
123
-
124
-
125
-
126
-
127
-
128
-
129
-
130
-
131
-
132
-
133
-
134
-
135
-
136
-
137
-
138
-
139
-
140
-
141
-
142
-
 143
143 -
 144
144 -
 145
145 -
 146
146 -
 147
147 -
 148
148 -
 149
149 -
 150
150 -
 151
151 -
 152
152 -
 153
153 -
 154
154 -
 155
155 -
 156
156 -
 157
157 -
 158
158 -
 159
159 -
 160
160 -
 161
161 -
 162
162 -
 163
163 -
164
-
165
-
166
-
167
-
168
-
169
-
170
-
171
-
172
-
173
-
174
-
175
-
176
-
177
-
178
-
179
-
180
-
181
-
182
-
183
-
184
-
185
-
186
-
187
-
188
-
189
-
190
-
191
-
192
-
193
-
194
-
195
-
196
-
197
-
198
-
199
-
200
-
201
-
202
-
203
-
204
-
205
-
206
-
207
-
208
-
209
-
210
-
211
-
212
-
213
-
214
-
215
-
216
-
217
-
218
-
219
-
220
-
221
-
222
-
223
-
224
-
225
-
226
-
227
-
228
-
229
-
230
-
231
-
232
-
233
-
234
-
235
-
236
-
237
-
238
-
239
-
240
-
241
-
242
-
243
-
244
-
245
-
246
-
247
-
248
-
249
-
250
-
251
-
252
 |
 |
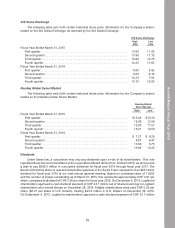
In fiscal year 2015, the following approved share buyback programs were in place:
Share Buyback Program Shares
Approved
Amounts
March 2014 . . . . . . . . . . . . . . . . . . . . . . . . . . . . . . . . . . . . . . . . . . . . . . . . . . . . . . . 17,311 $250,000
In September 2012, the Company’s shareholders approved the cancellation of the 18.5 million
shares repurchased under the September 2008 amended share buyback program. These shares were
legally cancelled during the quarter ended December 31, 2013.
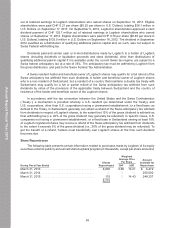
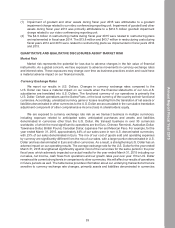
Performance Graph
The information contained in the Performance Graph shall not be deemed to be “soliciting material”
or “filed” with the SEC or subject to the liabilities of Section 18 of the Securities Exchange Act of 1934, as
amended (the “Exchange Act”), except to the extent that we specifically incorporate it by reference into a
document filed under the Securities Act of 1933, as amended (the “Securities Act”), or the Exchange Act.
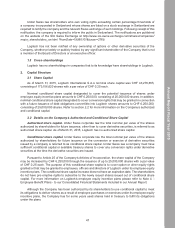
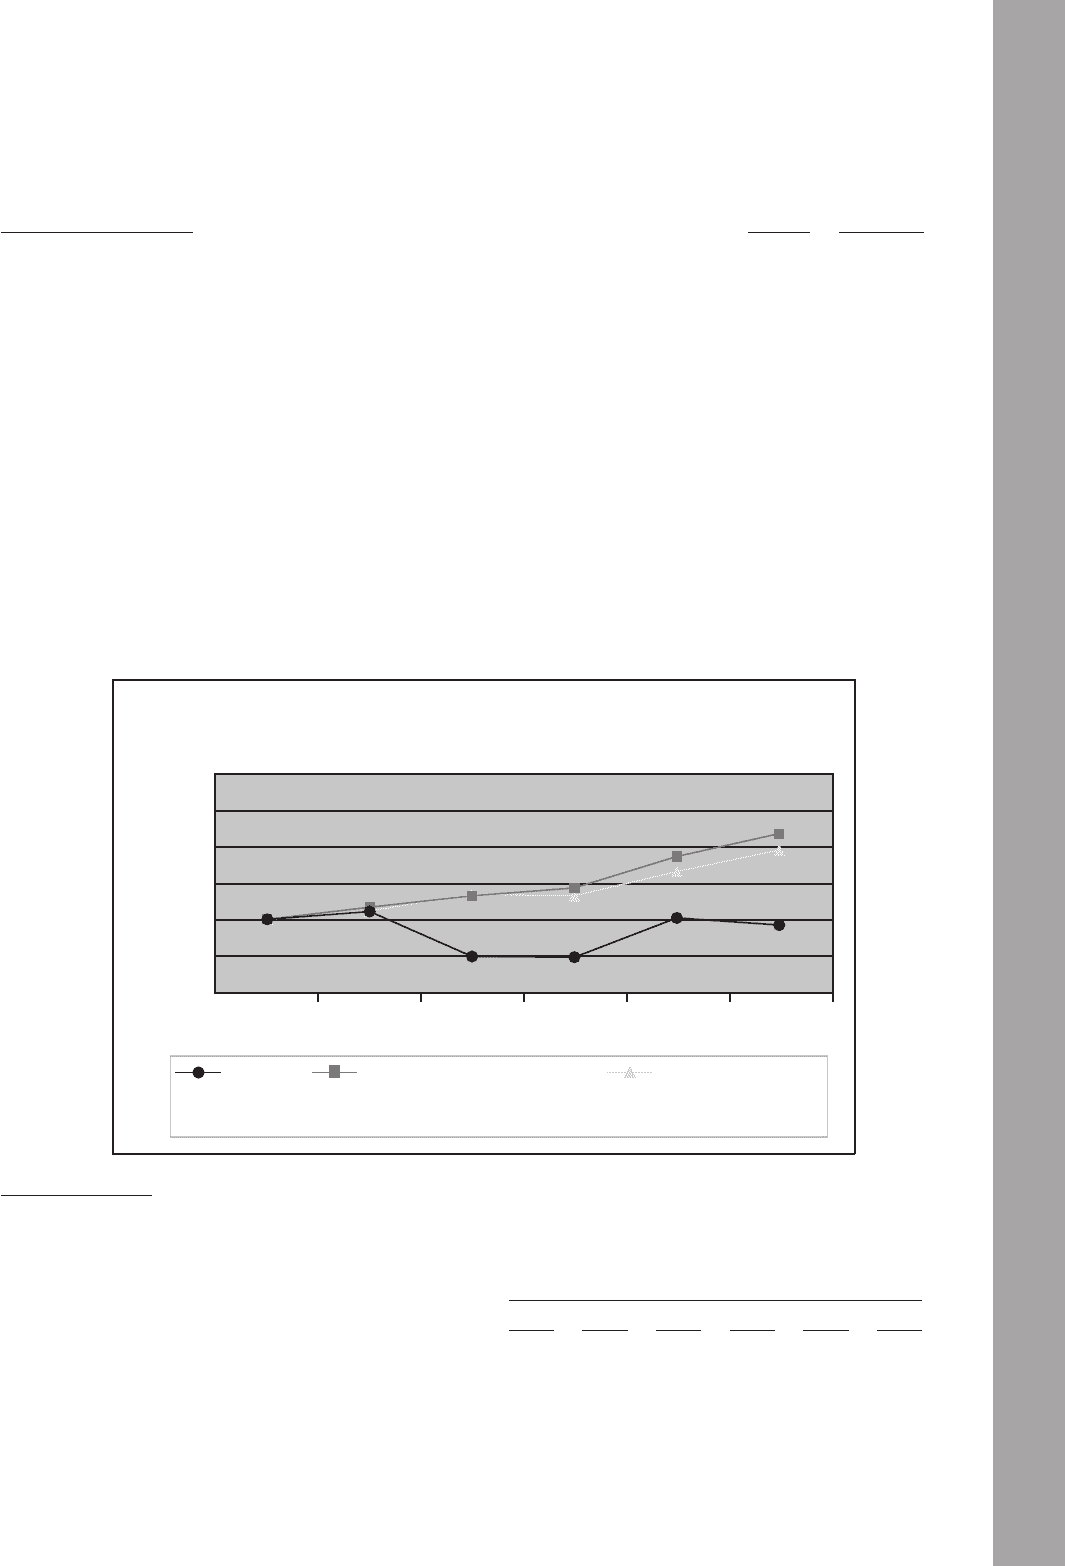
The following graph compares the cumulative total stockholder return on our shares, the Nasdaq
Composite Index, and the S&P 500 Information and Technology Index. The graph assumes that $100
was invested in our shares, the Nasdaq Composite Index and the S&P 500 Information and Technology
Index on March 31, 2010, and calculates the annual return through March 31, 2015. The stock price
performance on the following graph is not necessarily indicative of future stock price performance.
Logitech Nasdaq Composite Index S&P 500 Index
Logitech Nasdaq Composite Index S&P 500
Information and
Technology Index
Comparison of 5 year cumulative total return
2010 2011 2012 2013 2014 2015
$-
$50
$100
$150
$200
$250
$300
* $100 invested on March 31, 2010 in stock or index, including reinvestment of dividends.
Copyright© 2015 S&P, a division of The McGraw-Hill Companies Inc. All rights reserved.
March 31,
2010 2011 2012 2013 2014 2015
Logitech . . . . . . . . . . . . . . . . . . . . . . . . . . . . . . . . . . . . $100 $111 $ 48 $ 47 $102 $ 92
Nasdaq Composite Index . . . . . . . . . . . . . . . . . . . . . . $100 $117 $133 $144 $188 $220
S&P 500 Information and Technology Index . . . . . . . . $100 $112 $135 $133 $167 $197
37
Annual Report Fiscal Year 2015