Logitech 2015 Annual Report Download - page 141
Download and view the complete annual report
Please find page 141 of the 2015 Logitech annual report below. You can navigate through the pages in the report by either clicking on the pages listed below, or by using the keyword search tool below to find specific information within the annual report.-
 1
1 -
2
-
3
-
4
-
5
-
6
-
7
-
8
-
9
-
10
-
11
-
12
-
13
-
14
-
15
-
16
-
17
-
18
-
19
-
20
-
21
-
22
-
23
-
24
-
25
-
26
-
27
-
28
-
29
-
30
-
31
-
32
-
33
-
34
-
35
-
36
-
37
-
38
-
39
-
40
-
41
-
42
-
43
-
44
-
45
-
46
-
47
-
48
-
49
-
50
-
51
-
52
-
53
-
54
-
55
-
56
-
57
-
58
-
59
-
60
-
61
-
62
-
63
-
64
-
65
-
66
-
67
-
68
-
69
-
70
-
71
-
72
-
73
-
74
-
75
-
76
-
77
-
78
-
79
-
80
-
81
-
82
-
83
-
84
-
85
-
86
-
87
-
88
-
89
-
90
-
91
-
92
-
93
-
94
-
95
-
96
-
97
-
98
-
99
-
100
-
101
-
102
-
103
-
104
-
105
-
106
-
107
-
108
-
109
-
110
-
111
-
112
-
113
-
114
-
115
-
116
-
117
-
118
-
119
-
120
-
121
-
122
-
123
-
124
-
125
-
126
-
127
-
128
-
129
-
130
-
 131
131 -
 132
132 -
 133
133 -
 134
134 -
 135
135 -
 136
136 -
 137
137 -
 138
138 -
 139
139 -
 140
140 -
 141
141 -
 142
142 -
 143
143 -
 144
144 -
 145
145 -
 146
146 -
 147
147 -
 148
148 -
 149
149 -
 150
150 -
 151
151 -
152
-
153
-
154
-
155
-
156
-
157
-
158
-
159
-
160
-
161
-
162
-
163
-
164
-
165
-
166
-
167
-
168
-
169
-
170
-
171
-
172
-
173
-
174
-
175
-
176
-
177
-
178
-
179
-
180
-
181
-
182
-
183
-
184
-
185
-
186
-
187
-
188
-
189
-
190
-
191
-
192
-
193
-
194
-
195
-
196
-
197
-
198
-
199
-
200
-
201
-
202
-
203
-
204
-
205
-
206
-
207
-
208
-
209
-
210
-
211
-
212
-
213
-
214
-
215
-
216
-
217
-
218
-
219
-
220
-
221
-
222
-
223
-
224
-
225
-
226
-
227
-
228
-
229
-
230
-
231
-
232
-
233
-
234
-
235
-
236
-
237
-
238
-
239
-
240
-
241
-
242
-
243
-
244
-
245
-
246
-
247
-
248
-
249
-
250
-
251
-
252
 |
 |

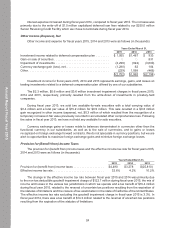
The change in the effective income tax rate between fiscal year 2014 and 2013 was primarily due to
the mix of income and losses in the various tax jurisdictions and a tax benefit of $14.3 million during fiscal
year 2014, related to the reversal of uncertain tax positions resulting from the expiration of the statutes of
limitations. In fiscal year 2013, there was a tax benefit of $35.6 million related to the reversal of uncertain
tax positions resulting from the closure of federal income tax examinations in the United States.
On December 19, 2014, the enactment of the Tax Increase Prevention Act of 2014 in the United
States extended the federal research and development tax credit through December 31, 2014 which had
previously expired on December 31, 2013. The provision for income taxes for fiscal year ended March 31,
2015 reflected a $0.9 million tax benefit as a result of the extension of the tax credit.
As of March 31, 2015 and March 31, 2014, the total amount of unrecognized tax benefits due to
uncertain tax positions was $79.0 million and $91.0 million, respectively, of which $79.0 million and
$86.1 million would affect the effective income tax rate if recognized, respectively.
As of March 31, 2015, we had $72.1 million in non-current income taxes payable and $0.1 million
in current income taxes payable, including interest and penalties, related to our income tax liability
for uncertain tax positions. As of March 31, 2014, we had $93.1 million in non-current income taxes
payable and $0.3 million in current income taxes payable. Pursuant to ASU 2013-11, Presentation of
an Unrecognized Tax Benefit When a Net Operating Loss Carryforward, a Similar Tax Loss, or a Tax
Credit Carryforward Exists, which became effective in the first quarter of fiscal year 2015, we reclassified
$10.3 million of unrecognized tax benefits previously presented as non-current income taxes payable to
a reduction in non-current deferred tax assets primarily for tax credit carryforwards.
We continue to recognize interest and penalties related to unrecognized tax positions in income tax
expense. We recognized $0.8 million, $1.1 million and $1.0 million in interest and penalties in income tax
expense during fiscal years 2015, 2014 and 2013, respectively. As of March 31, 2015, 2014 and 2013, we
had approximately $4.9 million, $5.6 million and $6.6 million of accrued interest and penalties related to
uncertain tax positions.
We file Swiss and foreign tax returns. We received final tax assessments in Switzerland through
fiscal year 2012. For other foreign jurisdictions such as the United States, we are generally not subject
to tax examinations for years prior to fiscal year 2011. We are under examination and have received
assessment notices in foreign tax jurisdictions. If the examinations are resolved unfavorably, there is a
possibility they may have a material negative impact on our results of operations.
Liquidity and Capital Resources
Cash Balances, Available Borrowings, and Capital Resources
At March 31, 2015, we had cash and cash equivalents of $537.0 million, compared with $469.4 million
at March 31, 2014. Our cash and cash equivalents consist of bank demand deposits and short-term time
deposits of which 81% is held by our Swiss-based entities and 11% is held by our subsidiaries in Hong
Kong and China. We do not expect to incur any material adverse tax impact or be significantly inhibited
by any country in which we do business from the repatriation of funds to Switzerland, our home domicile.
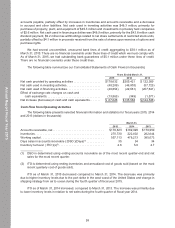
At March 31, 2015, our working capital was $557.1 million compared with working capital of
$478.2 million at March 31, 2014. The increase in working capital over the prior year was primarily due to
higher cash and inventory balances, partially offset by higher accounts payable balances at March 31, 2015.
During fiscal year 2015, we generated $178.6 million cash from operating activities. Our main sources
of operating cash flows were from net income after adding back non-cash expenses of depreciation,
amortization, impairment of goodwill and share-based compensation expense, and from an increase in
25
Annual Report Fiscal Year 2015