Logitech 2015 Annual Report Download - page 156
Download and view the complete annual report
Please find page 156 of the 2015 Logitech annual report below. You can navigate through the pages in the report by either clicking on the pages listed below, or by using the keyword search tool below to find specific information within the annual report.-
 1
1 -
2
-
3
-
4
-
5
-
6
-
7
-
8
-
9
-
10
-
11
-
12
-
13
-
14
-
15
-
16
-
17
-
18
-
19
-
20
-
21
-
22
-
23
-
24
-
25
-
26
-
27
-
28
-
29
-
30
-
31
-
32
-
33
-
34
-
35
-
36
-
37
-
38
-
39
-
40
-
41
-
42
-
43
-
44
-
45
-
46
-
47
-
48
-
49
-
50
-
51
-
52
-
53
-
54
-
55
-
56
-
57
-
58
-
59
-
60
-
61
-
62
-
63
-
64
-
65
-
66
-
67
-
68
-
69
-
70
-
71
-
72
-
73
-
74
-
75
-
76
-
77
-
78
-
79
-
80
-
81
-
82
-
83
-
84
-
85
-
86
-
87
-
88
-
89
-
90
-
91
-
92
-
93
-
94
-
95
-
96
-
97
-
98
-
99
-
100
-
101
-
102
-
103
-
104
-
105
-
106
-
107
-
108
-
109
-
110
-
111
-
112
-
113
-
114
-
115
-
116
-
117
-
118
-
119
-
120
-
121
-
122
-
123
-
124
-
125
-
126
-
127
-
128
-
129
-
130
-
131
-
132
-
133
-
134
-
135
-
136
-
137
-
138
-
139
-
140
-
141
-
142
-
143
-
144
-
145
-
 146
146 -
 147
147 -
 148
148 -
 149
149 -
 150
150 -
 151
151 -
 152
152 -
 153
153 -
 154
154 -
 155
155 -
 156
156 -
 157
157 -
 158
158 -
 159
159 -
 160
160 -
 161
161 -
 162
162 -
 163
163 -
 164
164 -
 165
165 -
 166
166 -
167
-
168
-
169
-
170
-
171
-
172
-
173
-
174
-
175
-
176
-
177
-
178
-
179
-
180
-
181
-
182
-
183
-
184
-
185
-
186
-
187
-
188
-
189
-
190
-
191
-
192
-
193
-
194
-
195
-
196
-
197
-
198
-
199
-
200
-
201
-
202
-
203
-
204
-
205
-
206
-
207
-
208
-
209
-
210
-
211
-
212
-
213
-
214
-
215
-
216
-
217
-
218
-
219
-
220
-
221
-
222
-
223
-
224
-
225
-
226
-
227
-
228
-
229
-
230
-
231
-
232
-
233
-
234
-
235
-
236
-
237
-
238
-
239
-
240
-
241
-
242
-
243
-
244
-
245
-
246
-
247
-
248
-
249
-
250
-
251
-
252
 |
 |

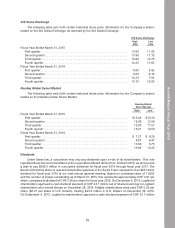
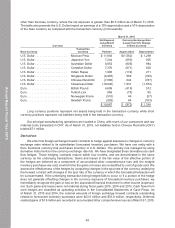
other than the base currency, where the net exposure is greater than $0.5 million as of March 31, 2015.
The table also presents the U.S. Dollar impact on earnings of a 10% appreciation and a 10% depreciation
of the base currency as compared with the transaction currency (in thousands):
March 31, 2015
Currency
Net Exposed
Long (Short)
Currency
Currency Exchange Gain
(Loss) from 10% Change
in Base Currency
Base Currency
Transaction
Currency Position Appreciation Depreciation
U.S. Dollar . . . . . . . . . . . . . . . . . . . . Mexican Peso $ 11,684 $(1,062) $ 1,298
U.S. Dollar . . . . . . . . . . . . . . . . . . . . Japanese Yen 7,244 (659) 805
U.S. Dollar . . . . . . . . . . . . . . . . . . . . Australian Dollar 8,852 (805) 984
U.S. Dollar . . . . . . . . . . . . . . . . . . . . Canadian Dollar 7,376 (671) 820
U.S. Dollar . . . . . . . . . . . . . . . . . . . . Indian Rupee 1,896 (172) 211
U.S. Dollar . . . . . . . . . . . . . . . . . . . . Singapore Dollar (6,483) 589 (720)
U.S. Dollar . . . . . . . . . . . . . . . . . . . . Chinese Renminbi (7,086) 644 (787)
U.S. Dollar . . . . . . . . . . . . . . . . . . . . Taiwanese Dollar (16,846) 1,531 (1,872)
Euro . . . . . . . . . . . . . . . . . . . . . . . . . British Pound 4,609 (419) 512
Euro . . . . . . . . . . . . . . . . . . . . . . . . . Turkish Lira 859 (78) 95
Euro . . . . . . . . . . . . . . . . . . . . . . . . . Norwegian Krone (510) 46 (57)
Euro . . . . . . . . . . . . . . . . . . . . . . . . . Swedish Krona (928) 84 (103)
$ 10,667 $ (972) $ 1,186
Long currency positions represent net assets being held in the transaction currency while short
currency positions represent net liabilities being held in the transaction currency.
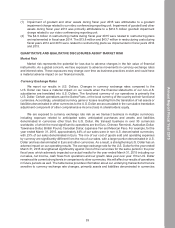
Our principal manufacturing operations are located in China, with much of our component and raw
material costs transacted in CNY. As of March 31, 2015, net liabilities held in Chinese Renminbi (CNY)
totaled $7.1 million.
Derivatives
We enter into foreign exchange forward contracts to hedge against exposure to changes in currency
exchange rates related to its subsidiaries’ forecasted inventory purchases. We have one entity with a
Euro functional currency that purchases inventory in U.S. Dollars. The primary risk managed by using
derivative instruments is the currency exchange rate risk. We have designated these derivatives as cash
flow hedges. These hedging contracts mature within four months, and are denominated in the same
currency as the underlying transactions. Gains and losses in the fair value of the effective portion of
the hedges are deferred as a component of accumulated other comprehensive loss until the hedged
inventory purchases are sold, at which time the gains or losses are reclassified to cost of goods sold. We
assess the effectiveness of the hedges by comparing changes in the spot rate of the currency underlying
the forward contract with changes in the spot rate of the currency in which the forecasted transaction will
be consummated. If the underlying transaction being hedged fails to occur or if a portion of the hedge
does not generate offsetting changes in the currency exposure of forecasted inventory purchases, we
immediately recognize the gain or loss on the associated financial instrument in other income (expense),
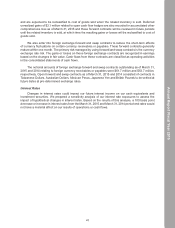
net. Such gains and losses were not material during fiscal years 2015, 2014 and 2013. Cash flows from
such hedges are classified as operating activities in the Consolidated Statements of Cash Flows. As
of March 31, 2015 and 2014, the notional amounts of foreign exchange forward contracts outstanding
related to forecasted inventory purchases were $43.5 million and $51.8 million, respectively. Deferred
realized gains of $1.9 million are recorded in accumulated other comprehensive loss as of March 31, 2015,
40
Annual Report Fiscal Year 2015