Logitech 2015 Annual Report Download - page 70
Download and view the complete annual report
Please find page 70 of the 2015 Logitech annual report below. You can navigate through the pages in the report by either clicking on the pages listed below, or by using the keyword search tool below to find specific information within the annual report.-
 1
1 -
2
-
3
-
4
-
5
-
6
-
7
-
8
-
9
-
10
-
11
-
12
-
13
-
14
-
15
-
16
-
17
-
18
-
19
-
20
-
21
-
22
-
23
-
24
-
25
-
26
-
27
-
28
-
29
-
30
-
31
-
32
-
33
-
34
-
35
-
36
-
37
-
38
-
39
-
40
-
41
-
42
-
43
-
44
-
45
-
46
-
47
-
48
-
49
-
50
-
51
-
52
-
53
-
54
-
55
-
56
-
57
-
58
-
59
-
 60
60 -
 61
61 -
 62
62 -
 63
63 -
 64
64 -
 65
65 -
 66
66 -
 67
67 -
 68
68 -
 69
69 -
 70
70 -
 71
71 -
 72
72 -
 73
73 -
 74
74 -
 75
75 -
 76
76 -
 77
77 -
 78
78 -
 79
79 -
 80
80 -
81
-
82
-
83
-
84
-
85
-
86
-
87
-
88
-
89
-
90
-
91
-
92
-
93
-
94
-
95
-
96
-
97
-
98
-
99
-
100
-
101
-
102
-
103
-
104
-
105
-
106
-
107
-
108
-
109
-
110
-
111
-
112
-
113
-
114
-
115
-
116
-
117
-
118
-
119
-
120
-
121
-
122
-
123
-
124
-
125
-
126
-
127
-
128
-
129
-
130
-
131
-
132
-
133
-
134
-
135
-
136
-
137
-
138
-
139
-
140
-
141
-
142
-
143
-
144
-
145
-
146
-
147
-
148
-
149
-
150
-
151
-
152
-
153
-
154
-
155
-
156
-
157
-
158
-
159
-
160
-
161
-
162
-
163
-
164
-
165
-
166
-
167
-
168
-
169
-
170
-
171
-
172
-
173
-
174
-
175
-
176
-
177
-
178
-
179
-
180
-
181
-
182
-
183
-
184
-
185
-
186
-
187
-
188
-
189
-
190
-
191
-
192
-
193
-
194
-
195
-
196
-
197
-
198
-
199
-
200
-
201
-
202
-
203
-
204
-
205
-
206
-
207
-
208
-
209
-
210
-
211
-
212
-
213
-
214
-
215
-
216
-
217
-
218
-
219
-
220
-
221
-
222
-
223
-
224
-
225
-
226
-
227
-
228
-
229
-
230
-
231
-
232
-
233
-
234
-
235
-
236
-
237
-
238
-
239
-
240
-
241
-
242
-
243
-
244
-
245
-
246
-
247
-
248
-
249
-
250
-
251
-
252
 |
 |
Compensation Report for Fiscal Year 2015
– Proxy Statement | 60
2015 Annual General Meeting Invitation, Proxy Statement
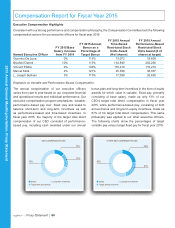
Executive Compensation Highlights
Consistent with our strong performance and compensation philosophy, the Compensation Committee took the following
compensation actions for our executive officers for fiscal year 2015:
Named Executive Officer
FY 2015 Base
Salary Increase
from FY 2014
FY 2015 Annual
Bonus as a
Percentage of
Target Bonus
FY 2015 Annual
Time-Based
Restricted Stock
Units Award
(# of shares)
FY 2015 Annual
Performance-Based
Restricted Stock
Units Award (# of
shares at target)
Guerrino De Luca 0% 113% 13,072 19,608
Bracken Darrell 10% 113% 134,840 202,260
Vincent Pilette 0% 140% 110,210 110,210
Marcel Stolk 2% 121% 25,358 38,037
L. Joseph Sullivan 3% 113% 17,090 25,635
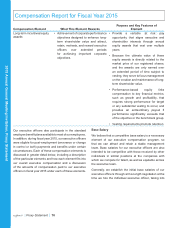
Emphasis on Variable and Performance-Based Compensation
The annual compensation of our executive officers
varies from year to year based on our corporate financial
and operational results and individual performance. Our
executive compensation program emphasizes “variable”
performance-based pay over “fixed” pay and seeks to
balance short-term and long-term incentives as well
as performance-based and time-based incentives. In
fiscal year 2015, the majority of the target total direct
compensation of our CEO consisted of performance-
based pay, including cash awarded under our annual
bonus plan and long-term incentives in the form of equity
awards for which value is variable. Fixed pay, primarily
consisting of base salary, made up only 13% of our
CEO’s target total direct compensation in fiscal year
2015, while performance-based pay, consisting of both
annual bonus and long-term equity incentives, made up
87% of his target total direct compensation. This same
philosophy was applied to our other executive officers.
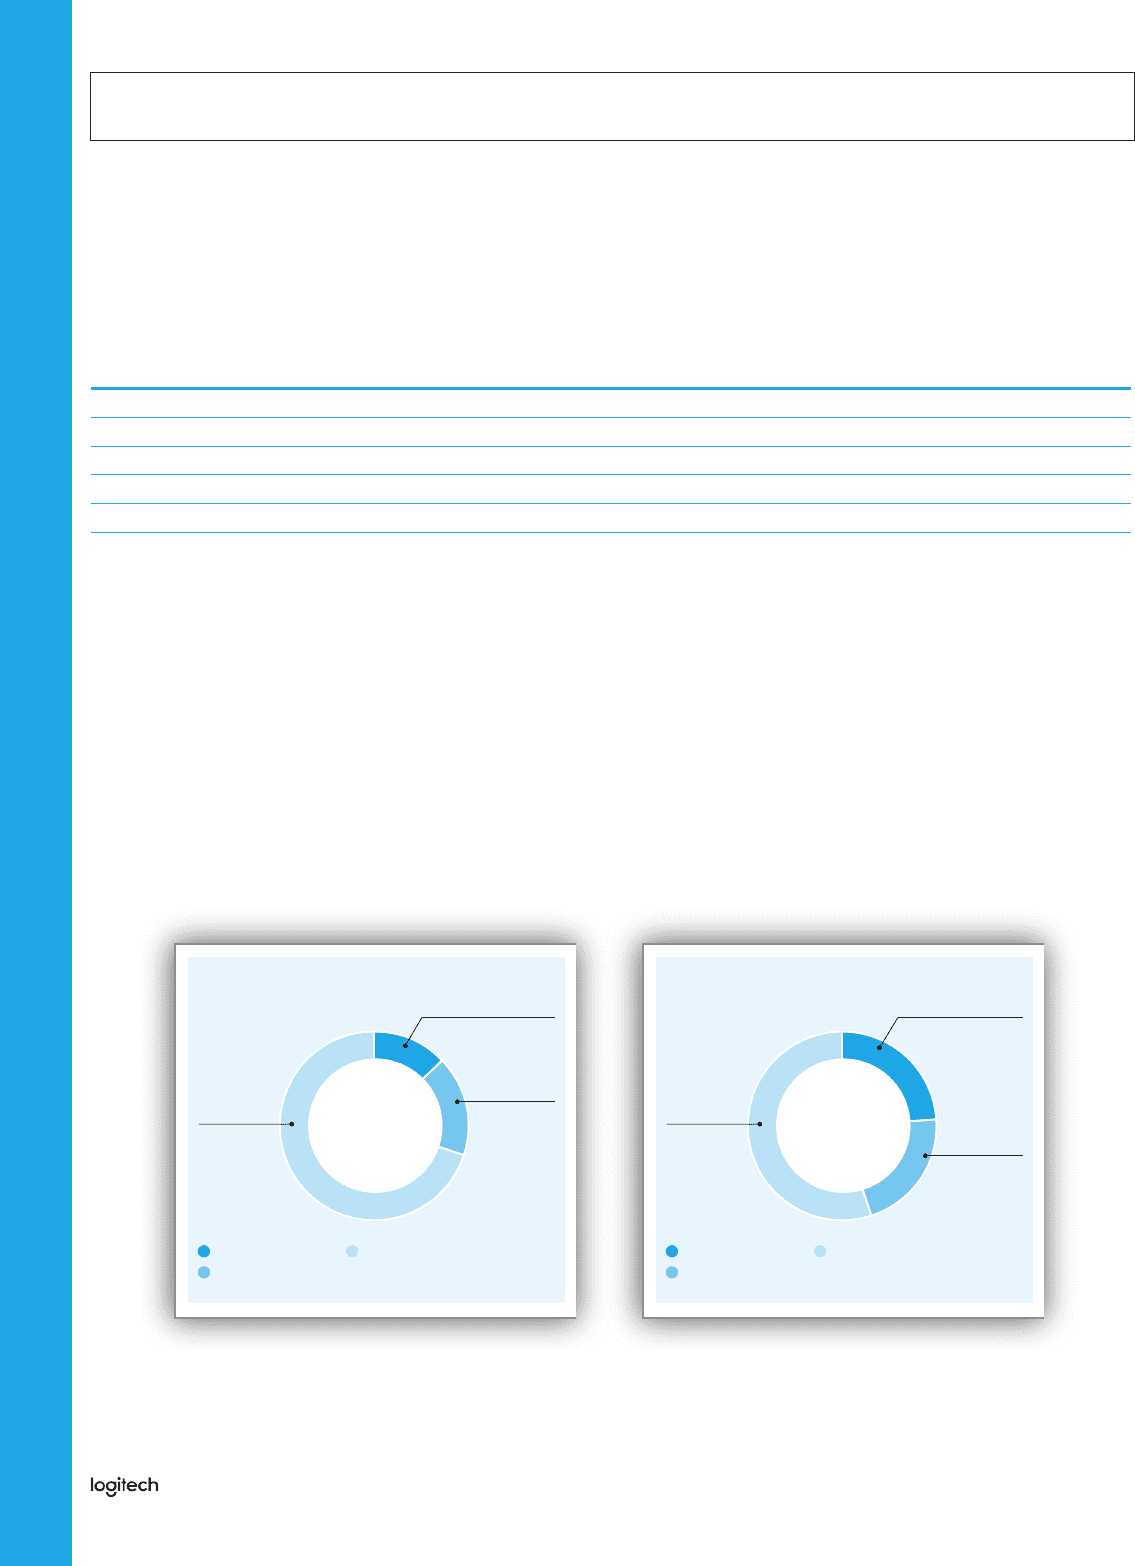
The following charts show the percentages of target
variable pay versus target fixed pay for fiscal year 2015:
17%
13%
70%
Target annual incentive
Salary Long-term incentives
CEO COMPENSATION MIX
21%
24%
55%
Target annual incentive
Salary Long-term incentives
OTHER NEO COMPENSATION MIX