Logitech 2015 Annual Report Download - page 219
Download and view the complete annual report
Please find page 219 of the 2015 Logitech annual report below. You can navigate through the pages in the report by either clicking on the pages listed below, or by using the keyword search tool below to find specific information within the annual report.-
 1
1 -
2
-
3
-
4
-
5
-
6
-
7
-
8
-
9
-
10
-
11
-
12
-
13
-
14
-
15
-
16
-
17
-
18
-
19
-
20
-
21
-
22
-
23
-
24
-
25
-
26
-
27
-
28
-
29
-
30
-
31
-
32
-
33
-
34
-
35
-
36
-
37
-
38
-
39
-
40
-
41
-
42
-
43
-
44
-
45
-
46
-
47
-
48
-
49
-
50
-
51
-
52
-
53
-
54
-
55
-
56
-
57
-
58
-
59
-
60
-
61
-
62
-
63
-
64
-
65
-
66
-
67
-
68
-
69
-
70
-
71
-
72
-
73
-
74
-
75
-
76
-
77
-
78
-
79
-
80
-
81
-
82
-
83
-
84
-
85
-
86
-
87
-
88
-
89
-
90
-
91
-
92
-
93
-
94
-
95
-
96
-
97
-
98
-
99
-
100
-
101
-
102
-
103
-
104
-
105
-
106
-
107
-
108
-
109
-
110
-
111
-
112
-
113
-
114
-
115
-
116
-
117
-
118
-
119
-
120
-
121
-
122
-
123
-
124
-
125
-
126
-
127
-
128
-
129
-
130
-
131
-
132
-
133
-
134
-
135
-
136
-
137
-
138
-
139
-
140
-
141
-
142
-
143
-
144
-
145
-
146
-
147
-
148
-
149
-
150
-
151
-
152
-
153
-
154
-
155
-
156
-
157
-
158
-
159
-
160
-
161
-
162
-
163
-
164
-
165
-
166
-
167
-
168
-
169
-
170
-
171
-
172
-
173
-
174
-
175
-
176
-
177
-
178
-
179
-
180
-
181
-
182
-
183
-
184
-
185
-
186
-
187
-
188
-
189
-
190
-
191
-
192
-
193
-
194
-
195
-
196
-
197
-
198
-
199
-
200
-
201
-
202
-
203
-
204
-
205
-
206
-
207
-
208
-
 209
209 -
 210
210 -
 211
211 -
 212
212 -
 213
213 -
 214
214 -
 215
215 -
 216
216 -
 217
217 -
 218
218 -
 219
219 -
 220
220 -
 221
221 -
 222
222 -
 223
223 -
 224
224 -
 225
225 -
 226
226 -
 227
227 -
 228
228 -
 229
229 -
230
-
231
-
232
-
233
-
234
-
235
-
236
-
237
-
238
-
239
-
240
-
241
-
242
-
243
-
244
-
245
-
246
-
247
-
248
-
249
-
250
-
251
-
252
 |
 |

LOGITECH INTERNATIONAL S.A.
NOTES TO CONSOLIDATED FINANCIAL STATEMENTS (Continued)
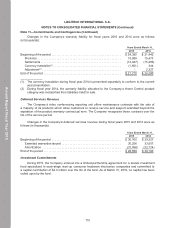
Note 8—Fair Value Measurements
The Company considers fair value as the exchange price that would be received for an asset or paid
to transfer a liability (an exit price) in the principal or most advantageous market for the asset or liability in
an orderly transaction between market participants at the measurement date. The Company utilizes the
following three-level fair value hierarchy to establish the priorities of the inputs used to measure fair value:
• Level 1—Quoted prices in active markets for identical assets or liabilities.
• Level 2—Observable inputs other than quoted market prices included in Level 1, such as quoted
prices for similar assets and liabilities in active markets; quoted prices for identical or similar
assets and liabilities in markets that are not active; or other inputs that are observable or can be
corroborated by observable market data.
• Level 3—Unobservable inputs that are supported by little or no market activity and that
are significant to the fair value of the assets or liabilities. This includes certain pricing
models, discounted cash flow methodologies and similar techniques that use significant
unobservable inputs.
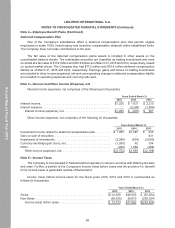
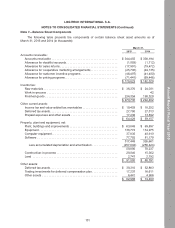
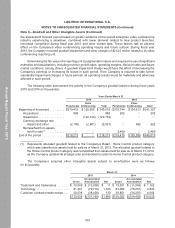
The following table presents the Company’s financial assets and liabilities, that were accounted
for at fair value on a recurring basis, excluding assets related to the Company’s defined benefit pension
plans, classified by the level within the fair value hierarchy (in thousands):
March 31, 2015 March 31, 2014
Level 1 Level 2 Level 1 Level 2
Cash equivalents:
Cash equivalents. . . . . . . . . . . . . . . . . . . . . . . . . . . . . . $264,647 $ — $200,641 $ —
$264,647 $ — $200,641 $ —
Trading investments for deferred compensation plan:
Money market funds . . . . . . . . . . . . . . . . . . . . . . . . . . . $ 2,936 $ — $ 3,139 $ —
Mutual funds . . . . . . . . . . . . . . . . . . . . . . . . . . . . . . . . . 14,301 — 13,472 —
$ 17,237 $ — $ 16,611 $ —
Foreign exchange derivative assets. . . . . . . . . . . . . . . . . . $ — $2,080 $ — $155
Foreign exchange derivative liabilities . . . . . . . . . . . . . . . . $ — $ 75 $ — $701
There were no material level 3 financial assets held by the Company during fiscal years 2015
or 2014.
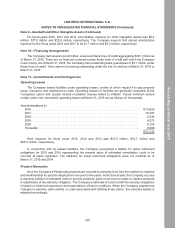
Investment Securities
The marketable securities for the Company’s deferred compensation plan are recorded at a fair
value of $17.2 million and $16.6 million as of March 31, 2015 and 2014, respectively, based on quoted
market prices. Quoted market prices are observable inputs that are classified as Level 1 within the fair
value hierarchy. Unrealized trading gains related to trading securities for the fiscal years 2015, 2014 and
2013 were not significant and are included in other income (expense), net.
Derivative Financial Instruments
Under certain agreements with the respective counterparties to the Company’s derivative contracts,
subject to applicable requirements, the Company is allowed to net settle transactions of the same type
with a single net amount payable by one party to the other. However, the Company presents its derivative
assets and derivative liabilities on a gross basis on the Consolidated Balance Sheets as of March 31,
2015 and 2014.
103
Annual Report Fiscal Year 2015