Foot Locker 2006 Annual Report Download - page 78
Download and view the complete annual report
Please find page 78 of the 2006 Foot Locker annual report below. You can navigate through the pages in the report by either clicking on the pages listed below, or by using the keyword search tool below to find specific information within the annual report.-
 1
1 -
2
-
3
-
4
-
5
-
6
-
7
-
8
-
9
-
10
-
11
-
12
-
13
-
14
-
15
-
16
-
17
-
18
-
19
-
20
-
21
-
22
-
23
-
24
-
25
-
26
-
27
-
28
-
29
-
30
-
31
-
32
-
33
-
34
-
35
-
36
-
37
-
38
-
39
-
40
-
41
-
42
-
43
-
44
-
45
-
46
-
47
-
48
-
49
-
50
-
51
-
52
-
53
-
54
-
55
-
56
-
57
-
58
-
59
-
60
-
61
-
62
-
63
-
64
-
65
-
66
-
67
-
 68
68 -
 69
69 -
 70
70 -
 71
71 -
 72
72 -
 73
73 -
 74
74 -
 75
75 -
 76
76 -
 77
77 -
 78
78 -
 79
79 -
 80
80 -
 81
81 -
 82
82 -
 83
83 -
 84
84 -
 85
85 -
 86
86 -
 87
87 -
 88
88 -
89
-
90
-
91
-
92
-
93
-
94
-
95
-
96
 |
 |

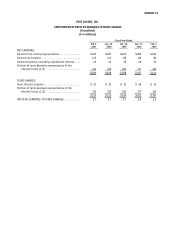
62
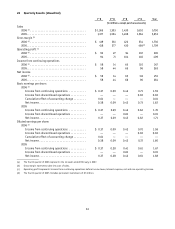
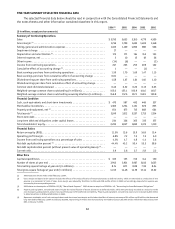
FIVE-YEAR SUMMARY OF SELECTED FINANCIAL DATA
The selected financial data below should be read in conjunction with the Consolidated Financial Statements and
the notes thereto and other information contained elsewhere in this report.
2006 (1) 2005 2004 2003 2002
($ in millions, except per share amounts)
Summary of Continuing Operations
Sales $ 5,750 5,653 5,355 4,779 4,509
Gross margin (2) ................................................... 1,736 1,709 1,633 1,482 1,348
Selling, general and administrative expenses ............................ 1,163 1,129 1,090 988 926
Impairment charge ............................................... 17 — — — —
Depreciation and amortization (2) ..................................... 175 171 154 152 153
Interest expense, net .............................................. 3 10 15 18 26
Other income .................................................... (14) (6) — — (3)
Income from continuing operations ................................... 247 263 255 209 162
Cumulative effect of accounting change (3) .............................. 1 — — (1) —
Basic earnings per share from continuing operations ...................... 1.59 1.70 1.69 1.47 1.15
Basic earnings per share from cumulative effect of accounting change ........ 0.01 — — — —
Diluted earnings per share from continuing operations. . . . . . . . . . . . . . . . . . . . . 1.58 1.67 1.64 1.40 1.10
Diluted earnings per share from cumulative effect of accounting change ....... — — — — —
Common stock dividends declared .................................... 0.40 0.32 0.26 0.15 0.03
Weighted-average common shares outstanding (in millions). . . . . . . . . . . . . . . . . 155.0 155.1 150.9 141.6 140.7
Weighted-average common shares outstanding assuming dilution (in millions) . . 156.8 157.6 157.1 152.9 150.8
Financial Condition
Cash, cash equivalents and short-term investments ....................... $ 470 587 492 448 357
Merchandise inventories ............................................ 1,303 1,254 1,151 920 835
Property and equipment, net (4) ....................................... 654 675 715 668 664
Total assets (4) .................................................... 3,249 3,312 3,237 2,713 2,514
Short-term debt .................................................. — — — — —
Long-term debt and obligations under capital leases ...................... 234 326 365 335 357
Total shareholders’ equity ........................................... 2,295 2,027 1,830 1,375 1,110
Financial Ratios
Return on equity (ROE) ............................................. 11.5% 13.6 15.9 16.8 15.4
Operating profit margin ............................................ 6.8% 7.2 7.3 7.2 6.0
Income from continuing operations as a percentage of sales ................ 4.3% 4.7 4.8 4.4 3.6
Net debt capitalization percent (5) .................................... 44.4% 45.2 50.4 53.3 58.6
Net debt capitalization percent (without present value of operating leases) (5) ... — — — — —
Current ratio ..................................................... 3.9 2.8 2.7 2.8 2.2
Other Data
Capital expenditures .............................................. $ 165 155 156 144 150
Number of stores at year end ........................................ 3,942 3,921 3,967 3,610 3,625
Total selling square footage at year end (in millions) ...................... 8.74 8.71 8.89 7.92 8.04
Total gross square footage at year end (in millions) ....................... 14.55 14.48 14.78 13.14 13.22
(1) 2006 represents the 53 weeks ended February 3, 2007.
(2) Gross margin and depreciation expense include the effects of the reclassification of tenant allowances as deferred credits, which are amortized as a reduction of rent
expense as a component of costs of sales. Gross margin was reduced by $5 million in 2004 and 2003 and $4 million in 2002 and accordingly, depreciation expense was
increased by the corresponding amount.
(3) 2006 relates to the adoption of SFAS No. 123(R), “Share-Based Payment.” 2003 relates to adoption of SFAS No. 143, “Accounting for Asset Retirement Obligations.”
(4) Property and equipment, net and total assets include the reclassification of tenant allowances as deferred credits, which were previously recorded as a reduction to the
cost of property and equipment, and are now classified as part of the deferred rent liability. Property and equipment, net and total assets were increased by $22 million
in 2004, $24 million in 2003 and $28 million in 2002.
(5) Represents total debt, net of cash, cash equivalents and short-term investments and includes the effect of interest rate swaps of $4 million and $1 million that decreased
long-term debt at February 3, 2007 and January 28, 2006, respectively, $4 million that increased long-term debt at January 29, 2005 and $1 million that reduced long-term
debt at January 31, 2004.