Foot Locker 2006 Annual Report Download - page 67
Download and view the complete annual report
Please find page 67 of the 2006 Foot Locker annual report below. You can navigate through the pages in the report by either clicking on the pages listed below, or by using the keyword search tool below to find specific information within the annual report.-
 1
1 -
2
-
3
-
4
-
5
-
6
-
7
-
8
-
9
-
10
-
11
-
12
-
13
-
14
-
15
-
16
-
17
-
18
-
19
-
20
-
21
-
22
-
23
-
24
-
25
-
26
-
27
-
28
-
29
-
30
-
31
-
32
-
33
-
34
-
35
-
36
-
37
-
38
-
39
-
40
-
41
-
42
-
43
-
44
-
45
-
46
-
47
-
48
-
49
-
50
-
51
-
52
-
53
-
54
-
55
-
56
-
 57
57 -
 58
58 -
 59
59 -
 60
60 -
 61
61 -
 62
62 -
 63
63 -
 64
64 -
 65
65 -
 66
66 -
 67
67 -
 68
68 -
 69
69 -
 70
70 -
 71
71 -
 72
72 -
 73
73 -
 74
74 -
 75
75 -
 76
76 -
 77
77 -
78
-
79
-
80
-
81
-
82
-
83
-
84
-
85
-
86
-
87
-
88
-
89
-
90
-
91
-
92
-
93
-
94
-
95
-
96
 |
 |

51
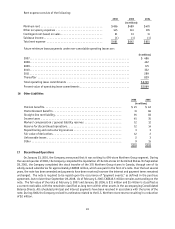
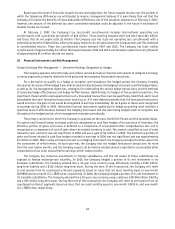
Interest Rate Risk Management
The Company has employed various interest rate swaps to minimize its exposure to interest rate fluctuations. These
swaps, which mature in 2022, have been designated as a fair value hedge of the changes in fair value of $100 million
of the Company’s 8.50 percent debentures payable in 2022 attributable to changes in interest rates and effectively
convert the interest rate on the debentures from 8.50 percent to a 1-month variable rate of LIBOR plus 3.45 percent.
The following table presents the Company’s outstanding interest rate derivatives:
2006 2005 2004
(in millions)
Interest Rate Swaps:
Fixed to Variable ($US) — notional amount ........... $ 100 $ 100 $ 100
Average pay rate . . . . . . . . . . . . . . . . . . . . . . . . . . . . . 8.53% 8.00% 6.46%
Average receive rate .......................... 8.50% 8.50% 8.50%
Variable to variable ($US) — notional amount ......... $ 100 $ 100 $ 100
Average pay rate . . . . . . . . . . . . . . . . . . . . . . . . . . . . . 5.57% 4.82% 2.73%
Average receive rate .......................... 5.32% 4.79% 3.25%
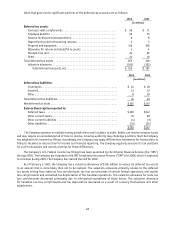
Fair Value
The following represents the fair value of foreign exchange derivative contracts and interest rate swaps:
2006 2005
(in millions)
Current assets .................................................... $ 1 $—
Non-current assets ................................................ — 1
Current liabilities ................................................. 2 1
Non-current liabilities ............................................. 12 2
Interest Rates
The Company’s major exposure to market risk is to changes in interest rates, primarily in the United States.
The table below presents the fair value of principal cash flows and related weighted-average interest rates by
maturity dates, including the effect of the interest rate swaps outstanding at February 3, 2007, of the Company’s long-
term debt obligations.
2007 2008 2009 2010 2011 Thereafter
Feb. 3,
2007
Total
Jan. 28,
2006
Total
($ in millions)
Long-term debt ........................... $ — 2 88 — — 132 $222 $330
Weighted-average interest rate ............... 7.8% 7.8% 7.8% 8.7% 8.7% 8.7%
Fair Value of Financial Instruments
The carrying value and estimated fair value of long-term debt was $220 million and $222 million, respectively, at
February 3, 2007 and $311 million and $330 million, respectively, at January 28, 2006. The carrying value and estimated
fair value of long-term investments and notes receivable was $18 million and $19 million, respectively, at February 3,
2007 and $33 million and $33 million, respectively, at January 28, 2006. The carrying value and estimated fair value of
short-term investment was $14 million and $15 million, respectively, at February 3, 2007. The carrying values of cash
and cash equivalents, other short-term investments and other current receivables and payables approximate their fair
value.