Foot Locker 2006 Annual Report Download - page 77
Download and view the complete annual report
Please find page 77 of the 2006 Foot Locker annual report below. You can navigate through the pages in the report by either clicking on the pages listed below, or by using the keyword search tool below to find specific information within the annual report.-
 1
1 -
2
-
3
-
4
-
5
-
6
-
7
-
8
-
9
-
10
-
11
-
12
-
13
-
14
-
15
-
16
-
17
-
18
-
19
-
20
-
21
-
22
-
23
-
24
-
25
-
26
-
27
-
28
-
29
-
30
-
31
-
32
-
33
-
34
-
35
-
36
-
37
-
38
-
39
-
40
-
41
-
42
-
43
-
44
-
45
-
46
-
47
-
48
-
49
-
50
-
51
-
52
-
53
-
54
-
55
-
56
-
57
-
58
-
59
-
60
-
61
-
62
-
63
-
64
-
65
-
66
-
 67
67 -
 68
68 -
 69
69 -
 70
70 -
 71
71 -
 72
72 -
 73
73 -
 74
74 -
 75
75 -
 76
76 -
 77
77 -
 78
78 -
 79
79 -
 80
80 -
 81
81 -
 82
82 -
 83
83 -
 84
84 -
 85
85 -
 86
86 -
 87
87 -
88
-
89
-
90
-
91
-
92
-
93
-
94
-
95
-
96
 |
 |

61
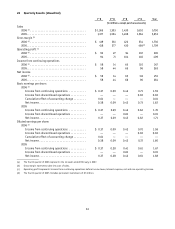
26 Quarterly Results (Unaudited)
1st Q2
nd Q3
rd Q4
th QYear
(in millions, except per share amounts)
Sales
2006 (a) .................................... $1,365 1,303 1,430 1,652 5,750
2005...................................... 1,377 1,304 1,408 1,564 5,653
Gross margin (b)
2006 (a) .................................... $ 419 361 422 534 1,736
2005...................................... 418 377 430 484
(d) 1,709
Operating profit (c)
2006 (a) .................................... $ 93 27 94 167 381
2005...................................... 94 71 104 140 409
Income from continuing operations
2006 (a) .................................... $ 58 14 65 110 247
2005...................................... 58 44 65 96 263
Net income
2006 (a) .................................... $ 59 14 65 113 251
2005...................................... 58 44 66 96 264
Basic earnings per share:
2006 (a)
Income from continuing operations ........... $ 0.37 0.09 0.42 0.71 1.59
Income from discontinued operations .......... — — — 0.02 0.02
Cumulative effect of accounting change ........ 0.01 — — — 0.01
Net income . . . . . . . . . . . . . . . . . . . . . . . . . . . . . . 0.38 0.09 0.42 0.73 1.62
2005
Income from continuing operations ........... $ 0.37 0.29 0.42 0.62 1.70
Income from discontinued operations .......... — — 0.01 — 0.01
Net income . . . . . . . . . . . . . . . . . . . . . . . . . . . . . . 0.37 0.29 0.43 0.62 1.71
Diluted earnings per share:
2006 (a)
Income from continuing operations ........... $ 0.37 0.09 0.42 0.70 1.58
Income from discontinued operations .......... — — — 0.02 0.02
Cumulative effect of accounting change ........ 0.01 — — — —
Net income . . . . . . . . . . . . . . . . . . . . . . . . . . . . . . 0.38 0.09 0.42 0.72 1.60
2005
Income from continuing operations ........... $ 0.37 0.28 0.41 0.61 1.67
Income from discontinued operations .......... — — 0.01 — 0.01
Net income . . . . . . . . . . . . . . . . . . . . . . . . . . . . . . 0.37 0.28 0.42 0.61 1.68
(a) The fourth quarter of 2006 represents the 14 weeks ended February 3, 2007.
(b) Gross margin represents sales less cost of sales.
(c) Operating profit represents income from continuing operations before income taxes, interest expense, net and non-operating income.
(d) The fourth quarter of 2005 includes permanent markdowns of $7 million.