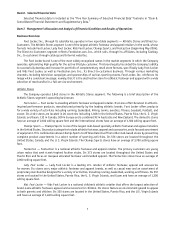
Foot Locker 2006 Annual Report Download - page 27
Download and view the complete annual report
Please find page 27 of the 2006 Foot Locker annual report below. You can navigate through the pages in the report by either clicking on the pages listed below, or by using the keyword search tool below to find specific information within the annual report.-
 1
1 -
2
-
3
-
4
-
5
-
6
-
7
-
8
-
9
-
10
-
11
-
12
-
13
-
14
-
15
-
16
-
 17
17 -
 18
18 -
 19
19 -
 20
20 -
 21
21 -
 22
22 -
 23
23 -
 24
24 -
 25
25 -
 26
26 -
 27
27 -
 28
28 -
 29
29 -
 30
30 -
 31
31 -
 32
32 -
 33
33 -
 34
34 -
 35
35 -
 36
36 -
 37
37 -
38
-
39
-
40
-
41
-
42
-
43
-
44
-
45
-
46
-
47
-
48
-
49
-
50
-
51
-
52
-
53
-
54
-
55
-
56
-
57
-
58
-
59
-
60
-
61
-
62
-
63
-
64
-
65
-
66
-
67
-
68
-
69
-
70
-
71
-
72
-
73
-
74
-
75
-
76
-
77
-
78
-
79
-
80
-
81
-
82
-
83
-
84
-
85
-
86
-
87
-
88
-
89
-
90
-
91
-
92
-
93
-
94
-
95
-
96
 |
 |

11
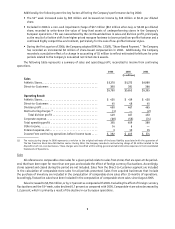
SG&A increased by $41 million to $1,129 million in 2005, or by 3.8 percent, as compared with 2004. SG&A as a
percentage of sales decreased to 20.0 percent as compared with 20.3 percent in 2004. The increase in SG&A is primarily
related to an increase in payroll and related costs. The effect of including Footaction for the full fiscal year is an
incremental $21 million, excluding the integration costs. During 2005, the Company donated 82,500 pairs of athletic
footwear with a cost of $2 million to Save the Children Foundation. This donation benefited the tsunami victims in
Banda Aceh, Indonesia, and Save the Children programs in the United States.
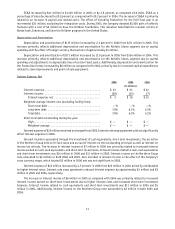
Depreciation and Amortization
Depreciation and amortization of $175 million increased by 2.3 percent in 2006 from $171 million in 2005. This
increase primarily reflects additional depreciation and amortization for the Athletic Stores segment due to capital
spending and the effect of foreign currency fluctuations of approximately $1 million.
Depreciation and amortization of $171 million increased by 11.0 percent in 2005 from $154 million in 2004. This
increase primarily reflects additional depreciation and amortization for the Athletic Stores segment due to capital
spending and adjustments to depreciable lives of certain fixed assets. Additionally, depreciation and amortization for
the Footaction format increased by $6 million as compared with 2004, primarily due to increased capital expenditures
related to store improvements and point-of-sale equipment.
Interest Expense, Net
2006 2005 2004
(in millions)
Interest expense .................................... $ 23 $ 23 $22
Interest income..................................... (20) (13) (7)
Interest expense, net .............................. $ 3 $ 10 $15
Weighted-average interest rate (excluding facility fees):
Short-term debt .................................. —% —% —%
Long-term debt................................... 7.8% 6.2% 5.2%
Total debt....................................... 7.8% 6.2% 5.2%
Short-term debt outstanding during the year:
High........................................... $ — $ — $—
Weighted-average................................. $ — $ — $—
Interest expense of $23 million remained unchanged from 2005. Interest rate swap agreements did not significantly
affect interest expense in 2006.
Interest income is generated through the investment of cash equivalents, short-term investments, the accretion
of the Northern Group note to its face value and accrual of interest on the outstanding principal, as well as interest on
income tax refunds. The increase in interest income of $7 million in 2006 was primarily related to increased interest
income earned on cash, cash equivalents, and short-term investments. Interest income related to cash, cash equivalents
and short-term investments was $14 million in 2006 and $11 million in 2005. Interest income on the Northern Group
note amounted to $2 million in both 2006 and 2005. Also included in interest income is the effect of the Company’s
cross currency swaps, which totaled $3 million in 2006 and was not significant in 2005.
Interest expense of $23 million increased by 4.5 percent in 2005 from $22 million in 2004 primarily attributable
to higher interest rates. Interest rate swap agreements reduced interest expense by approximately $1 million and $3
million in 2005 and 2004, respectively.
The increase in interest income of $6 million in 2005 as compared with 2004 was primarily related to increased
interest income earned on short-term investments due to higher interest rates and increased short-term investment
balances. Interest income related to cash equivalents and short-term investments was $11 million in 2005 and $5
million in 2004. Additionally, interest income on the Northern Group note amounted to $2 million in both 2005 and
2004.