Foot Locker 2006 Annual Report Download - page 25
Download and view the complete annual report
Please find page 25 of the 2006 Foot Locker annual report below. You can navigate through the pages in the report by either clicking on the pages listed below, or by using the keyword search tool below to find specific information within the annual report.-
 1
1 -
2
-
3
-
4
-
5
-
6
-
7
-
8
-
9
-
10
-
11
-
12
-
13
-
14
-
 15
15 -
 16
16 -
 17
17 -
 18
18 -
 19
19 -
 20
20 -
 21
21 -
 22
22 -
 23
23 -
 24
24 -
 25
25 -
 26
26 -
 27
27 -
 28
28 -
 29
29 -
 30
30 -
 31
31 -
 32
32 -
 33
33 -
 34
34 -
 35
35 -
36
-
37
-
38
-
39
-
40
-
41
-
42
-
43
-
44
-
45
-
46
-
47
-
48
-
49
-
50
-
51
-
52
-
53
-
54
-
55
-
56
-
57
-
58
-
59
-
60
-
61
-
62
-
63
-
64
-
65
-
66
-
67
-
68
-
69
-
70
-
71
-
72
-
73
-
74
-
75
-
76
-
77
-
78
-
79
-
80
-
81
-
82
-
83
-
84
-
85
-
86
-
87
-
88
-
89
-
90
-
91
-
92
-
93
-
94
-
95
-
96
 |
 |

9
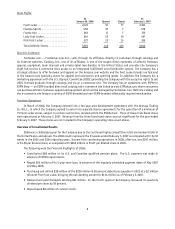
Additionally, the following were the key factors affecting the Company’s performance during 2006:
•The 53
rd week increased sales by $95 million and increased net income by $18 million or $0.11 per diluted
share.
• Included in 2006 is a non-cash impairment charge of $17 million ($12 million after-tax), or $0.08 per diluted
share, recorded to write-down the value of long-lived assets of underperforming stores in the Company’s
European operations. This was necessitated by the continued declines in sales and division profit, principally
as the result of a fashion shift from higher priced marquee footwear to lower priced low-profile footwear and a
continued highly competitive environment, particularly for the sale of low-profile footwear styles.
•During the first quarter of 2006, the Company adopted SFAS No. 123(R), “Share-Based Payment.” The Company
has recorded an incremental $6 million of share-based compensation in 2006. Additionally, the Company
recorded a cumulative effect of a change in accounting of $1 million to reflect estimated forfeitures for prior
periods related to the Company’s nonvested restricted stock awards.
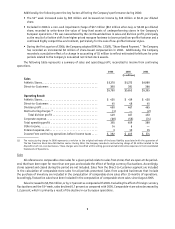
The following table represents a summary of sales and operating profit, reconciled to income from continuing
operations.
2006 2005 2004
(in millions)
Sales
Athletic Stores.................................... $5,370 $5,272 $4,989
Direct-to-Customers ............................... 380 381 366
$5,750 $5,653 $5,355
Operating Result
Athletic Stores.................................... $ 405 $ 419 $ 420
Direct-to-Customers ............................... 45 48 45
Division profit.................................... 450 467 465
Restructuring charges (1) ............................ (1) — (2)
Total division profit ............................. 449 467 463
Corporate expense................................. (68) (58) (74)
Total operating profit .............................. 381 409 389
Other income..................................... 14 6 —
Interest expense, net............................... 3 10 15
Income from continuing operations before income taxes.... $ 392 $ 405 $ 374
(1) The restructuring charge in 2006 represents a revision to the original estimate of the lease liability associated with the guarantee of
The San Francisco Music Box distribution center. During 2004, the Company recorded a restructuring charge of $2 million related to the
dispositions of non-core businesses. These charges were classified within selling, general and administrative expenses in the Consolidated
Statements of Operations.
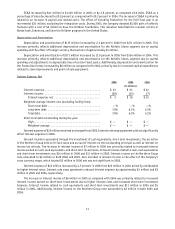
Sales
All references to comparable-store sales for a given period relate to sales from stores that are open at the period-
end, that have been open for more than one year, and exclude the effect of foreign currency fluctuations. Accordingly,
stores opened and closed during the period are not included. Sales from the Direct-to-Customer segment are included
in the calculation of comparable-store sales for all periods presented. Sales from acquired businesses that include
the purchase of inventory are included in the computation of comparable-store sales after 15 months of operations.
Accordingly, Footaction sales have been included in the computation of comparable-store sales since August 2005.
Sales increased to $5,750 million, or by 1.7 percent as compared with 2005. Excluding the effect of foreign currency
fluctuations and the 53rd week, sales declined 0.7 percent as compared with 2005. Comparable-store sales decreased by
1.2 percent, which is primarily a result of the decline in our European operations.