Foot Locker 2006 Annual Report Download - page 29
Download and view the complete annual report
Please find page 29 of the 2006 Foot Locker annual report below. You can navigate through the pages in the report by either clicking on the pages listed below, or by using the keyword search tool below to find specific information within the annual report.-
 1
1 -
2
-
3
-
4
-
5
-
6
-
7
-
8
-
9
-
10
-
11
-
12
-
13
-
14
-
15
-
16
-
17
-
18
-
 19
19 -
 20
20 -
 21
21 -
 22
22 -
 23
23 -
 24
24 -
 25
25 -
 26
26 -
 27
27 -
 28
28 -
 29
29 -
 30
30 -
 31
31 -
 32
32 -
 33
33 -
 34
34 -
 35
35 -
 36
36 -
 37
37 -
 38
38 -
 39
39 -
40
-
41
-
42
-
43
-
44
-
45
-
46
-
47
-
48
-
49
-
50
-
51
-
52
-
53
-
54
-
55
-
56
-
57
-
58
-
59
-
60
-
61
-
62
-
63
-
64
-
65
-
66
-
67
-
68
-
69
-
70
-
71
-
72
-
73
-
74
-
75
-
76
-
77
-
78
-
79
-
80
-
81
-
82
-
83
-
84
-
85
-
86
-
87
-
88
-
89
-
90
-
91
-
92
-
93
-
94
-
95
-
96
 |
 |

13
2005 compared with 2004
Athletic Stores sales of $5,272 million increased 5.7 percent in 2005, as compared with $4,989 million in 2004.
Excluding the effect of foreign currency fluctuations, primarily related to the euro, sales from athletic store formats
increased 5.5 percent in 2005. Comparable-store sales increased by 2.6 percent in 2005. These increases were primarily
driven by sales related to the Footaction division, which was acquired in May 2004. Approximately $126 million of the
increase in Footaction represented the inclusion of their operations for the full year in 2005. Champs Sports experienced
a strong increase in sales during 2005, as this format benefited from higher quantities of marquee athletic footwear and
private-label apparel. Foot Locker Canada also experienced increased sales. Excluding the effect of foreign currency
fluctuations, Foot Locker Europe’s sales were essentially flat as compared with the corresponding prior-year period.
Division profit from Athletic Stores decreased by 0.2 percent to $419 million in 2005 from $420 million in 2004.
Division profit as a percentage of sales decreased to 7.9 percent in 2005 from 8.4 percent in 2004. This decline is
primarily a result of the decreased profit from the European operations as compared with the prior year. The continued
weak economy, the increased competitive environment and a fashion shift from higher priced marquee footwear to
lower priced low-profile footwear negatively affected Europe’s operating results. In addition during 2005, Foot Locker
Europe recorded significantly higher markdowns as a result of the continued promotional environment, particularly in
the U.K. and France, and to clear excess inventory. Despite these factors, in 2005 Foot Locker Europe achieved a double-
digit division profit margin. The decline in Europe was partially offset by the improved results at the Footaction,
Champs Sports and Canadian divisions. The increase in Footaction is primarily a result of the inclusion of its results for
the full year as compared with a partial year during 2004.
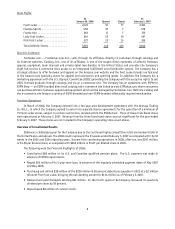
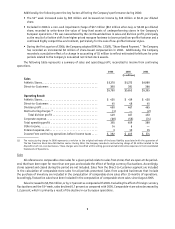
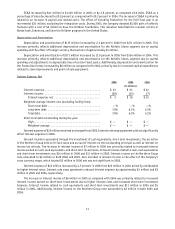
Direct-to-Customers
2006 2005 2004
(in millions)
Sales .............................................. $380 $381 $366
Division profit ...................................... $ 45 $ 48 $ 45
Sales as a percentage of consolidated total ................. 7% 7% 7%
Division profit margin ................................. 11.8% 12.6% 12.3%
2006 compared with 2005
Direct-to-Customers sales decreased to $380 million in 2006, as compared with $381 million in 2005. Internet
sales increased to $270 million, increasing by 11.1 percent as compared with 2005. Catalog sales decreased by 20.3
percent to $110 million in 2006 from $138 million in 2005. Management believes that the decrease in catalog sales,
which was substantially offset by the increase in Internet sales, is a result of customers browsing and selecting products
through its catalogs and then making their purchases via the Internet. Sales for the Direct-to-Customer business were
negatively affected by the termination of a third party arrangement in the early part of 2006.
The Direct-to-Customers business generated division profit of $45 million in 2006, as compared with $48 million
in 2005. Division profit, as a percentage of sales, decreased to 11.8 percent in 2006 from 12.6 percent in 2005. Several
initiatives were implemented to mitigate the loss of revenue from the cancelled third party contract, such as expanding
the ESPN offerings. However, these iniatitives did not fully offset the loss in profit which resulted in a decline in
division profit. The effect of the 53rd week on this segment was not significant.
2005 compared with 2004
Direct-to-Customers sales increased 4.1 percent to $381 million in 2005, as compared with $366 million 2004.
The growth of the Internet business continued to drive sales in 2005. Internet sales increased by 14.6 percent to $243
million from $212 million in 2004. Catalog sales decreased by 10.4 percent to $138 million in 2005 from $154 million
in 2004. Management believes that the decrease in catalog sales, which was substantially offset by the increase in
Internet sales, is a result of customers browsing and selecting products through its catalogs and then making their
purchases via the Internet.
The Direct-to-Customers business generated division profit of $48 million in 2005, as compared with $45 million
in 2004. Division profit, as a percentage of sales, increased to 12.6 percent in 2005 from 12.3 percent in 2004. This
reflects the Company’s alliances with third parties, such as the USOC and ESPN.