Foot Locker 2006 Annual Report Download - page 74
Download and view the complete annual report
Please find page 74 of the 2006 Foot Locker annual report below. You can navigate through the pages in the report by either clicking on the pages listed below, or by using the keyword search tool below to find specific information within the annual report.-
 1
1 -
2
-
3
-
4
-
5
-
6
-
7
-
8
-
9
-
10
-
11
-
12
-
13
-
14
-
15
-
16
-
17
-
18
-
19
-
20
-
21
-
22
-
23
-
24
-
25
-
26
-
27
-
28
-
29
-
30
-
31
-
32
-
33
-
34
-
35
-
36
-
37
-
38
-
39
-
40
-
41
-
42
-
43
-
44
-
45
-
46
-
47
-
48
-
49
-
50
-
51
-
52
-
53
-
54
-
55
-
56
-
57
-
58
-
59
-
60
-
61
-
62
-
63
-
 64
64 -
 65
65 -
 66
66 -
 67
67 -
 68
68 -
 69
69 -
 70
70 -
 71
71 -
 72
72 -
 73
73 -
 74
74 -
 75
75 -
 76
76 -
 77
77 -
 78
78 -
 79
79 -
 80
80 -
 81
81 -
 82
82 -
 83
83 -
 84
84 -
85
-
86
-
87
-
88
-
89
-
90
-
91
-
92
-
93
-
94
-
95
-
96
 |
 |

58
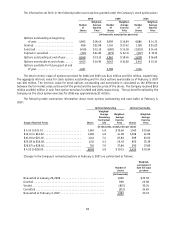
The information set forth in the following table covers options granted under the Company’s stock option plans:
2006 2005 2004
Number
of
Shares
Weighted-
Average
Exercise
Price
Number
of
Shares
Weighted-
Average
Exercise
Price
Number
of
Shares
Weighted-
Average
Exercise
Price
(in thousands, except prices per share)
Options outstanding at beginning
of year ........................ 5,962 $18.45 5,909 $16.69 6,886 $14.73
Granted ......................... 858 $23.98 1,014 $27.42 1,183 $25.20
Exercised ........................ (459) $15.12 (682) $ 15.03 (1,853) $ 14.43
Expired or cancelled ................ (313) $24.83 (279) $22.11 (307) $ 19.13
Options outstanding at end of year ..... 6,048 $19.15 5,962 $18.45 5,909 $16.69
Options exercisable at end of year ...... 4,455 $16.94 4,042 $16.00 3,441 $15.34
Options available for future grant at end
of year ........................ 4,931 5,768 7,464
The total intrinsic value of options exercised for 2006 and 2005 was $4.0 million and $7.6 million, respectively.
The aggregate intrinsic value for stock options outstanding and for stock options exercisable as of February 3, 2007
was $30 million. The intrinsic value for stock options outstanding and exercisable is calculated as the difference
between the fair market value as the end of the period and the exercise price of the shares. The Company received $6.8
million and $9.5 million in cash from option exercises for 2006 and 2005, respectively. The tax benefit realized by the
Company on the stock option exercises for 2006 was approximately $1 million.
The following table summarizes information about stock options outstanding and exercisable at February 3,
2007:
Options Outstanding Options Exercisable
Range of Exercise Prices Shares
Weighted-
Average
Remaining
Contractual
Life
Weighted-
Average
Exercise
Price Shares
Weighted-
Average
Exercise
Price
(in thousands, except prices per share)
$ 4.53 to $11.91 ........................ 1,540 4.8 $10.64 1,540 $10.64
$12.31 to $16.02 ........................ 1,306 4.6 14.90 1,306 14.90
$16.19 to $25.19 ........................ 1,241 7.4 22.80 399 20.52
$25.28 to $26.66 ........................ 1,211 5.3 25.42 920 25.39
$26.87 to $28.50 ........................ 750 7.9 27.86 290 27.80
$ 4.53 to $28.50 ........................ 6,048 5.8 $19.15 4,455 $16.94
Changes in the Company’s nonvested options at February 3, 2007 are summarized as follows:
Number of
shares
Weighted-
average grant
date fair value
per share
(in thousands)
Nonvested at January 29, 2006 ............................ 1,920 $23.59
Granted ............................................. 858 23.98
Vested .............................................. (872) 20.35
Cancelled ............................................ (313) 24.83
Nonvested at February 3, 2007 ............................ 1,593 25.33