Experian 2015 Annual Report Download - page 44
Download and view the complete annual report
Please find page 44 of the 2015 Experian annual report below. You can navigate through the pages in the report by either clicking on the pages listed below, or by using the keyword search tool below to find specific information within the annual report.-
 1
1 -
2
-
3
-
4
-
5
-
6
-
7
-
8
-
9
-
10
-
11
-
12
-
13
-
14
-
15
-
16
-
17
-
18
-
19
-
20
-
21
-
22
-
23
-
24
-
25
-
26
-
27
-
28
-
29
-
30
-
31
-
32
-
33
-
 34
34 -
 35
35 -
 36
36 -
 37
37 -
 38
38 -
 39
39 -
 40
40 -
 41
41 -
 42
42 -
 43
43 -
 44
44 -
 45
45 -
 46
46 -
 47
47 -
 48
48 -
 49
49 -
 50
50 -
 51
51 -
 52
52 -
 53
53 -
 54
54 -
55
-
56
-
57
-
58
-
59
-
60
-
61
-
62
-
63
-
64
-
65
-
66
-
67
-
68
-
69
-
70
-
71
-
72
-
73
-
74
-
75
-
76
-
77
-
78
-
79
-
80
-
81
-
82
-
83
-
84
-
85
-
86
-
87
-
88
-
89
-
90
-
91
-
92
-
93
-
94
-
95
-
96
-
97
-
98
-
99
-
100
-
101
-
102
-
103
-
104
-
105
-
106
-
107
-
108
-
109
-
110
-
111
-
112
-
113
-
114
-
115
-
116
-
117
-
118
-
119
-
120
-
121
-
122
-
123
-
124
-
125
-
126
-
127
-
128
-
129
-
130
-
131
-
132
-
133
-
134
-
135
-
136
-
137
-
138
-
139
-
140
-
141
-
142
-
143
-
144
-
145
-
146
-
147
-
148
-
149
-
150
-
151
-
152
-
153
-
154
-
155
-
156
-
157
-
158
-
159
-
160
-
161
-
162
-
163
-
164
-
165
-
166
-
167
-
168
-
169
-
170
-
171
-
172
-
173
-
174
-
175
-
176
-
177
-
178
-
179
 |
 |

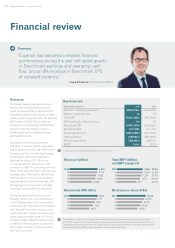
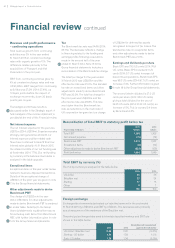
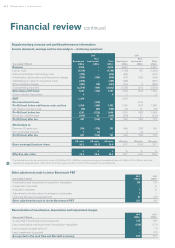
Financial review continued
Capital allocation and returns
Capital allocation
During the year ended 31 March 2015,
the Group reviewed its capital allocation
framework as part of the strategic priority
to rigorously optimise capital. This review
encompassed our risk and capital returns
framework, our balance sheet structure,
and the scope and mechanism for future
shareholder returns.
The key conclusions of our review,
announced in January 2015, were that:
• the Group has strong cash generation
potential, which provides substantial
cash flow for investment, both organic
and inorganic, to meet the Group’s
strategic goals;
• the capital allocation process can
provide greater emphasis on the
assessment of risk in the investment
appraisal process;
• there is scope to enhance the
efficiency of the capital structure,
whilst sustaining strong investment-
grade credit ratings and sufficient
flexibility for future investment;
• the Group’s strong cash profile
provides the potential to progress
the level of the ordinary dividend
payment over time; and
• the rate of future cash generation
is expected to continue to provide
residual capital, for additional returns
to shareholders.
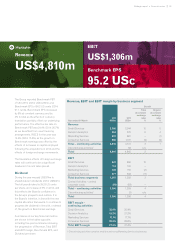
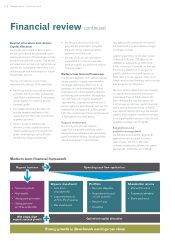
Medium-term financial framework
The Group’s aspiration is to deliver average
annual growth in organic revenue in the
mid single-digit range. Our focus is on
growing our core businesses with their
track record of robust operating margins
and strong cash generation. By applying
our cash flows into organic investment
opportunities, acquisitions and returns of
excess capital to shareholders, we have the
potential for strong growth in Benchmark
EPS. This medium-term financial framework
is illustrated in the chart below.
Organic investment
Our priority is to allocate capital in
support of our growth ambitions, whilst
driving business efficiency and generating
good investment returns. We will prioritise
growth investment in core activities.
Acquisitions will continue to form part of
the investment mix, assessed by a range
of stringent criteria.
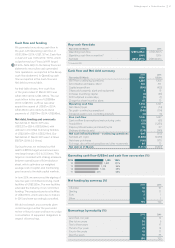
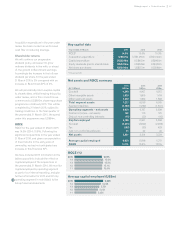
Capital expenditure in the year ended
31 March 2015 was US$380m (2014:
US$402m), representing 7.9% (2014:
8.3%) of revenue. Expenditure through
the income statement in support of
growth initiatives included spend on
Data Labs in three regions, sales force
transformation and training, restructuring
and productivity initiatives.
We have already agreed process changes
to support these priorities and we are
embedding them in the business. We
have changed the way we assess risk
and the way we allocate capital internally,
with a more prominent focus on ROCE
and internal capital rationing. We require
organic and inorganic investment returns
to be significantly in excess of the Group’s
weighted average cost of capital.
Acquisitions and
portfolio management
We will test all acquisition proposals
against the use of capital for share
repurchases. We will continually
evaluate peripheral activities and, where
appropriate, rationalise accordingly.
Organic business Operating cash flow application
Medium-term financial framework
Organic investment
• Core focus
and optimised
• Capital expenditure
at 8% to 9% of revenue
• P&L investments
Optimised capital allocation
Strong growth in Benchmark earnings per share
Mid single-digit
organic revenue growth
• Structural growth
• High quality
• Strong cash generation
• Strong core and
portfolio optionality
Portfolio
• Non-core disposals
• Acquisitions focused
on core business
• Returns focus
• Discipline
Shareholder returns
• Efficient structure
• Progressive dividend
• Share purchases
42 Strategic report •Financial review