Experian 2015 Annual Report Download - page 32
Download and view the complete annual report
Please find page 32 of the 2015 Experian annual report below. You can navigate through the pages in the report by either clicking on the pages listed below, or by using the keyword search tool below to find specific information within the annual report.-
 1
1 -
2
-
3
-
4
-
5
-
6
-
7
-
8
-
9
-
10
-
11
-
12
-
13
-
14
-
15
-
16
-
17
-
18
-
19
-
20
-
21
-
 22
22 -
 23
23 -
 24
24 -
 25
25 -
 26
26 -
 27
27 -
 28
28 -
 29
29 -
 30
30 -
 31
31 -
 32
32 -
 33
33 -
 34
34 -
 35
35 -
 36
36 -
 37
37 -
 38
38 -
 39
39 -
 40
40 -
 41
41 -
 42
42 -
43
-
44
-
45
-
46
-
47
-
48
-
49
-
50
-
51
-
52
-
53
-
54
-
55
-
56
-
57
-
58
-
59
-
60
-
61
-
62
-
63
-
64
-
65
-
66
-
67
-
68
-
69
-
70
-
71
-
72
-
73
-
74
-
75
-
76
-
77
-
78
-
79
-
80
-
81
-
82
-
83
-
84
-
85
-
86
-
87
-
88
-
89
-
90
-
91
-
92
-
93
-
94
-
95
-
96
-
97
-
98
-
99
-
100
-
101
-
102
-
103
-
104
-
105
-
106
-
107
-
108
-
109
-
110
-
111
-
112
-
113
-
114
-
115
-
116
-
117
-
118
-
119
-
120
-
121
-
122
-
123
-
124
-
125
-
126
-
127
-
128
-
129
-
130
-
131
-
132
-
133
-
134
-
135
-
136
-
137
-
138
-
139
-
140
-
141
-
142
-
143
-
144
-
145
-
146
-
147
-
148
-
149
-
150
-
151
-
152
-
153
-
154
-
155
-
156
-
157
-
158
-
159
-
160
-
161
-
162
-
163
-
164
-
165
-
166
-
167
-
168
-
169
-
170
-
171
-
172
-
173
-
174
-
175
-
176
-
177
-
178
-
179
 |
 |
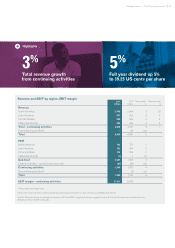
Total revenue from continuing activities in
North America was US$2,468m, up 3%,
while organic revenue declined by 2%. The
difference relates to the acquisitions of
Passport (completed November 2013) and
41st Parameter (completed October 2013).
Credit Services
Total revenue growth was 17% and organic
revenue growth was 7%, with strength
across all major areas of activity. We saw
steady progress in consumer information,
with good demand for credit reference
products as clients prospected for new
credit customers and originated new
loans. Business information performed
strongly, reflecting new business wins
and new product introductions. There was
strength in our automotive vertical, as
growth in automotive sales drove lending
volumes and demand for vehicle history
reports. Finally, we made significant
gains in health, as we secured new client
contracts from hospitals and physician
practices for revenue cycle management
services, and we delivered strong growth
in average order value as we expanded
existing customer relationships.
Decision Analytics
Total revenue growth was 9% and organic
revenue growth was 4%. Against a strong
prior year comparable, Decision Analytics
performed well, reflecting new PowerCurve
credit risk management implementations,
as well as growth in analytics.
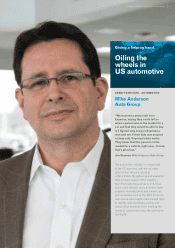
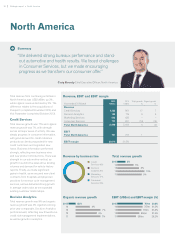
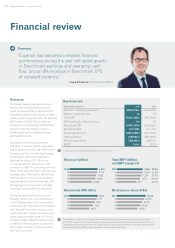
North America
Craig Boundy Chief Executive Officer, North America
“ We delivered strong bureaux performance and stand-
out automotive and health results. We faced challenges
in Consumer Services, but we made encouraging
progress as we transform our consumer offer.”
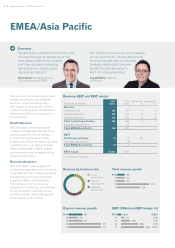
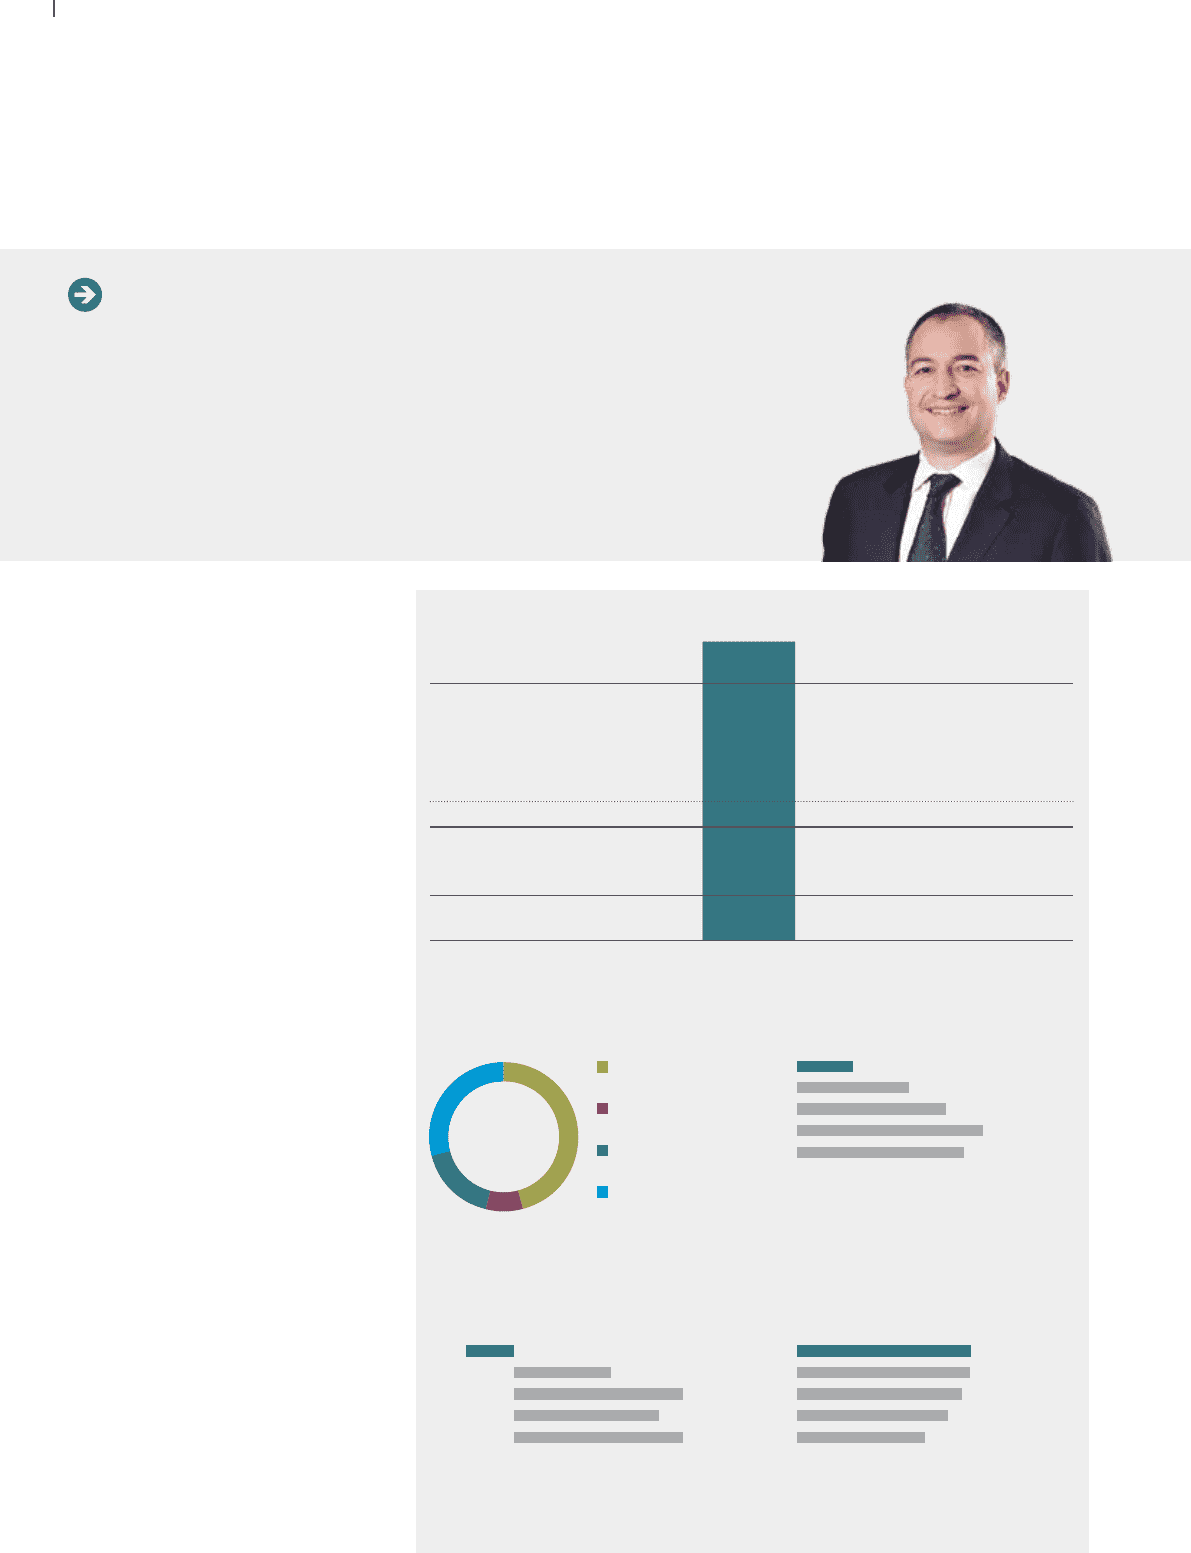
Summary
Revenue, EBIT and EBIT margin
761m 30.8%
757m 31.5%
718m 31.8%
2015
14
13
658m 31.5%
12
556m 29.2%
11
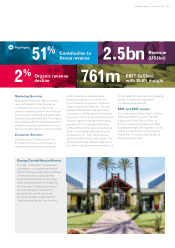
Revenue by business line
Credit
Services 46%
Decision
Analytics 8%
Marketing
Services 17%
Consumer
Services 29%
(2)%
4%
2015
14
13
6%
12
7%
11
3%
6%
8%
2015
14
13
10%
12
9%
11
Total revenue growth
Organic revenue growth EBIT (US$m) and EBIT margin (%)
7%
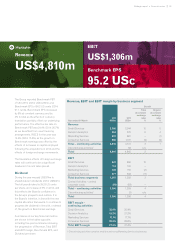
Year ended 31 March
2015
US$m
2014
US$m
Total growth
%
Organic growth
%
Revenue
Credit Services 1,125 961 17 7
Decision Analytics 194 179 9 4
Marketing Services 432 433 – –
Consumer Services 717 831 (14) (14)
Total North America 2,468 2,404 3(2)
EBIT
Total North America 761 757 1
EBIT margin 30.8% 31.5%
30 Strategic report •North America