Experian 2015 Annual Report Download - page 37
Download and view the complete annual report
Please find page 37 of the 2015 Experian annual report below. You can navigate through the pages in the report by either clicking on the pages listed below, or by using the keyword search tool below to find specific information within the annual report.-
 1
1 -
2
-
3
-
4
-
5
-
6
-
7
-
8
-
9
-
10
-
11
-
12
-
13
-
14
-
15
-
16
-
17
-
18
-
19
-
20
-
21
-
22
-
23
-
24
-
25
-
26
-
 27
27 -
 28
28 -
 29
29 -
 30
30 -
 31
31 -
 32
32 -
 33
33 -
 34
34 -
 35
35 -
 36
36 -
 37
37 -
 38
38 -
 39
39 -
 40
40 -
 41
41 -
 42
42 -
 43
43 -
 44
44 -
 45
45 -
 46
46 -
 47
47 -
48
-
49
-
50
-
51
-
52
-
53
-
54
-
55
-
56
-
57
-
58
-
59
-
60
-
61
-
62
-
63
-
64
-
65
-
66
-
67
-
68
-
69
-
70
-
71
-
72
-
73
-
74
-
75
-
76
-
77
-
78
-
79
-
80
-
81
-
82
-
83
-
84
-
85
-
86
-
87
-
88
-
89
-
90
-
91
-
92
-
93
-
94
-
95
-
96
-
97
-
98
-
99
-
100
-
101
-
102
-
103
-
104
-
105
-
106
-
107
-
108
-
109
-
110
-
111
-
112
-
113
-
114
-
115
-
116
-
117
-
118
-
119
-
120
-
121
-
122
-
123
-
124
-
125
-
126
-
127
-
128
-
129
-
130
-
131
-
132
-
133
-
134
-
135
-
136
-
137
-
138
-
139
-
140
-
141
-
142
-
143
-
144
-
145
-
146
-
147
-
148
-
149
-
150
-
151
-
152
-
153
-
154
-
155
-
156
-
157
-
158
-
159
-
160
-
161
-
162
-
163
-
164
-
165
-
166
-
167
-
168
-
169
-
170
-
171
-
172
-
173
-
174
-
175
-
176
-
177
-
178
-
179
 |
 |

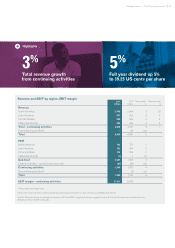
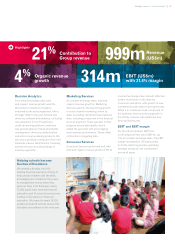
Highlights
EBIT (US$m)
with 31.4% margin
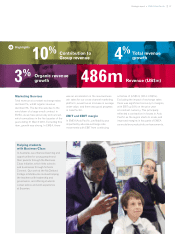
314m4%Organic revenue
growth
21%Contribution to
Group revenue
Decision Analytics
At constant exchange rates, total
and organic revenue growth was 3%.
Momentum in Decision Analytics
improved as the year progressed, with a
stronger finish to the year. Growth was
driven by software and analytics, including
new adoptions for our PowerCurve
credit decisioning platform, and there
was good progress in fraud and identity
management, driven by authentication
and anti-money laundering products. We
also saw a growing contribution from 41st
Parameter device identification, following
several wins across a broad range of
industry segments.
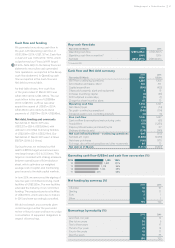
Marketing Services
At constant exchange rates, total and
organic revenue growth in Marketing
Services was 1%. We saw strong growth
in cross-channel marketing, driven by
sales to existing clients and new business
wins, including a major win in the financial
services segment. There was also further
progress across data quality, which
ended the year well, with encouraging
new business performance. These offset
contraction in targeting data.
Consumer Services
Consumer Services performed well, with
total and organic revenue growth of 8% at
constant exchange rates. Growth reflected
further momentum in the direct-to-
consumer operations, with growth in new
membership subscriptions during the year.
While it is a relatively small component of
the business, there was strong growth in
the affinity channel, with additional new
wins during the year.
EBIT and EBIT margin
For the UK and Ireland, EBIT from
continuing activities was US$314m, up
11% at constant exchange rates. The EBIT
margin increased by 130 basis points
to 31.4%, reflecting positive operating
leverage and good cost containment
across all areas.
999mRevenue
(US$m)
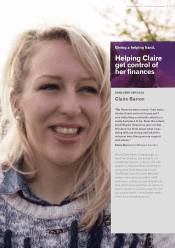
Helping schools become
Centres of Excellence
We worked with pfeg, the UK’s
leading financial education charity, to
help provide children with the skills,
knowledge and confidence they need
to manage their money when they
grow up. Now in its third year, nearly
10,000 pupils have received financial
education and 14 schools have become
Centres of Excellence in financial
education. We expect to reach 24,000
pupils and help 28 schools receive this
standard of excellence in the next year.
35Strategic report •UK and Ireland