Experian 2015 Annual Report Download - page 38
Download and view the complete annual report
Please find page 38 of the 2015 Experian annual report below. You can navigate through the pages in the report by either clicking on the pages listed below, or by using the keyword search tool below to find specific information within the annual report.-
 1
1 -
2
-
3
-
4
-
5
-
6
-
7
-
8
-
9
-
10
-
11
-
12
-
13
-
14
-
15
-
16
-
17
-
18
-
19
-
20
-
21
-
22
-
23
-
24
-
25
-
26
-
27
-
 28
28 -
 29
29 -
 30
30 -
 31
31 -
 32
32 -
 33
33 -
 34
34 -
 35
35 -
 36
36 -
 37
37 -
 38
38 -
 39
39 -
 40
40 -
 41
41 -
 42
42 -
 43
43 -
 44
44 -
 45
45 -
 46
46 -
 47
47 -
 48
48 -
49
-
50
-
51
-
52
-
53
-
54
-
55
-
56
-
57
-
58
-
59
-
60
-
61
-
62
-
63
-
64
-
65
-
66
-
67
-
68
-
69
-
70
-
71
-
72
-
73
-
74
-
75
-
76
-
77
-
78
-
79
-
80
-
81
-
82
-
83
-
84
-
85
-
86
-
87
-
88
-
89
-
90
-
91
-
92
-
93
-
94
-
95
-
96
-
97
-
98
-
99
-
100
-
101
-
102
-
103
-
104
-
105
-
106
-
107
-
108
-
109
-
110
-
111
-
112
-
113
-
114
-
115
-
116
-
117
-
118
-
119
-
120
-
121
-
122
-
123
-
124
-
125
-
126
-
127
-
128
-
129
-
130
-
131
-
132
-
133
-
134
-
135
-
136
-
137
-
138
-
139
-
140
-
141
-
142
-
143
-
144
-
145
-
146
-
147
-
148
-
149
-
150
-
151
-
152
-
153
-
154
-
155
-
156
-
157
-
158
-
159
-
160
-
161
-
162
-
163
-
164
-
165
-
166
-
167
-
168
-
169
-
170
-
171
-
172
-
173
-
174
-
175
-
176
-
177
-
178
-
179
 |
 |

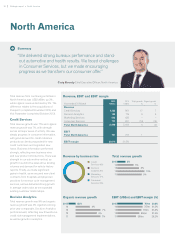
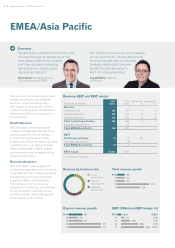
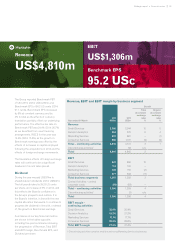
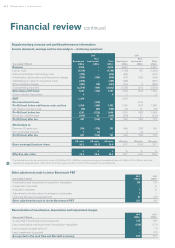
Revenue, EBIT and EBIT margin
(1)m (0.2)%
7m 1.4%
20m 4.1%
2015
14
13
38m 6.6%
12
52m 10.4%
11
Revenue by business line
Credit
Services 37%
Decision
Analytics 27%
Marketing
Services 36%
3%
2%
2015
14
13
7%
12
7%
11
4%
4%
4%
2015
14
13
17%
12
12%
11
Total revenue growth
Organic revenue growth
3%
EMEA/Asia Pacific
Year ended 31 March
2015
US$m
2014
US$m
Total growth1
%
Organic growth
1
%
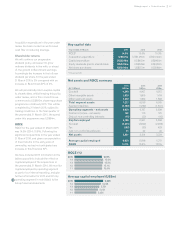
Revenue
Credit Services 182 187 4 4
Decision Analytics 130 127 10 9
Marketing Services 174 185 (1) (3)
Total continuing activities 486 499 4 3
Discontinuing activities –47
Total EMEA/Asia Pacific 486 546
EBIT
Continuing activities (1) 730
Discontinuing activities –(3)
Total EMEA/Asia Pacific (1) 4
EBIT margin (0.2)% 1.4%
1 At constant exchange rates.
EBIT (US$m) and EBIT margin (%)
36 Strategic report •EMEA/Asia Pacic
Total revenue from continuing activities
in EMEA/Asia Pacific was US$486m,
up 4% at constant exchange rates,
with organic revenue growth of 3% at
constant exchange rates. The difference
relates principally to the acquisition of
41st Parameter.
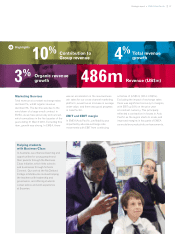
Credit Services
Total and organic revenue growth at
constant exchange rates was 4%. There
was strong growth from our bureaux
in Asia Pacific, particularly in India,
Singapore and China, as well as a growing
contribution from our start-up bureaux.
Revenues stabilised in EMEA, and we
saw progress across the majority of our
bureaux in that region.
Decision Analytics
Total and organic revenue growth at
constant exchange rates was 10% and 9%
respectively. Decision Analytics generally
strengthened as the year progressed
across both EMEA and Asia Pacific.
This followed action to refocus our
operations in Asia Pacific, and reflected
strong demand for credit decisioning
software in EMEA, with further growth
in key markets such as Turkey.
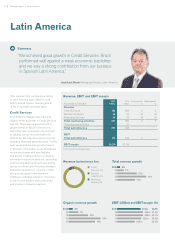
Summary
Joy Griffiths Chairman,
Asia Pacific
“ Our momentum and scale are increasing
across Asia Pacific. Having repositioned
the business last year, we returned
to double-digit organic revenue
growth this year and grew in
each of our business lines.”
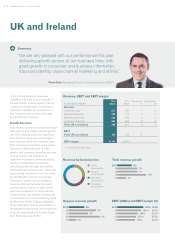
Chris Clark Managing Director,
UK and Ireland, and EMEA
“ We delivered a solid performance this year.
We have focused our operations on the
best opportunities in key markets
and have also seen increasing
demand for our analytics and
decisioning products.”