Experian 2015 Annual Report Download - page 101
Download and view the complete annual report
Please find page 101 of the 2015 Experian annual report below. You can navigate through the pages in the report by either clicking on the pages listed below, or by using the keyword search tool below to find specific information within the annual report.-
 1
1 -
2
-
3
-
4
-
5
-
6
-
7
-
8
-
9
-
10
-
11
-
12
-
13
-
14
-
15
-
16
-
17
-
18
-
19
-
20
-
21
-
22
-
23
-
24
-
25
-
26
-
27
-
28
-
29
-
30
-
31
-
32
-
33
-
34
-
35
-
36
-
37
-
38
-
39
-
40
-
41
-
42
-
43
-
44
-
45
-
46
-
47
-
48
-
49
-
50
-
51
-
52
-
53
-
54
-
55
-
56
-
57
-
58
-
59
-
60
-
61
-
62
-
63
-
64
-
65
-
66
-
67
-
68
-
69
-
70
-
71
-
72
-
73
-
74
-
75
-
76
-
77
-
78
-
79
-
80
-
81
-
82
-
83
-
84
-
85
-
86
-
87
-
88
-
89
-
90
-
 91
91 -
 92
92 -
 93
93 -
 94
94 -
 95
95 -
 96
96 -
 97
97 -
 98
98 -
 99
99 -
 100
100 -
 101
101 -
 102
102 -
 103
103 -
 104
104 -
 105
105 -
 106
106 -
 107
107 -
 108
108 -
 109
109 -
 110
110 -
 111
111 -
112
-
113
-
114
-
115
-
116
-
117
-
118
-
119
-
120
-
121
-
122
-
123
-
124
-
125
-
126
-
127
-
128
-
129
-
130
-
131
-
132
-
133
-
134
-
135
-
136
-
137
-
138
-
139
-
140
-
141
-
142
-
143
-
144
-
145
-
146
-
147
-
148
-
149
-
150
-
151
-
152
-
153
-
154
-
155
-
156
-
157
-
158
-
159
-
160
-
161
-
162
-
163
-
164
-
165
-
166
-
167
-
168
-
169
-
170
-
171
-
172
-
173
-
174
-
175
-
176
-
177
-
178
-
179
 |
 |

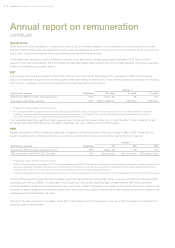
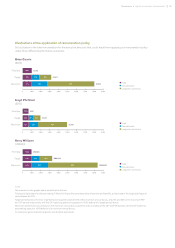
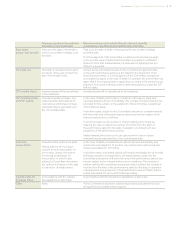
Illustrations of the application of remuneration policy
Set out below is the total remuneration for the executive directors that could result from applying our remuneration policy
under three different performance scenarios.
Notes
The scenarios in the graphs above are defined as follows:
Fixed pay is base salary for the year ending 31 March 2016 plus the annualised value of pension and benefits, as disclosed in the single total figure of
remuneration for 2015.
Target performance is the level of performance required to deliver 50% of the maximum annual bonus, and 25% and 50% of the maximum PSP
and CIP awards respectively, with the CIP matching award being based on 100% deferral of a target annual bonus.
Maximum performance would result in the maximum annual bonus payment and full vesting of the CIP and PSP awards, with the CIP matching
award being based on 100% deferral of a maximum annual bonus.
All scenarios ignore share price growth and dividend equivalents.
Fixed
Annual bonus
Long-term incentives
Fixed
Annual bonus
Long-term incentives
Fixed
Annual bonus
Long-term incentives
Brian Cassin
(£000)
Lloyd Pitchford
(£000)
Kerry Williams
(US$000)
01,000 5,0003,000 7,0002,000 6,0004,000 8,000 9,000
Fixed pay £1,023
100%
£3,211
Target 32% 27% 41%
£8,023
Maximum 13% 22% 65%
01,000 5,0003,000 7,0002,000 6,0004,000 8,000 9,000
Fixed pay £661
100%
£2 ,011
Target 27% 40%33%
£4,981
Maximum 22% 65%13%
01,000 5,0003,000 7,0002,000 6,0004,000 8,000 9,000
Fixed pay US$948
100%
US$3,261
Target 30% 28% 42%
US$8,348
Maximum 12% 22% 66%
99Governance •Report on directors’ remuneration