Dollar General 2004 Annual Report Download - page 59
Download and view the complete annual report
Please find page 59 of the 2004 Dollar General annual report below. You can navigate through the pages in the report by either clicking on the pages listed below, or by using the keyword search tool below to find specific information within the annual report.-
 1
1 -
2
-
3
-
4
-
5
-
6
-
7
-
8
-
9
-
10
-
11
-
12
-
13
-
14
-
15
-
16
-
17
-
18
-
19
-
20
-
21
-
22
-
23
-
24
-
25
-
26
-
27
-
28
-
29
-
30
-
31
-
32
-
33
-
34
-
35
-
36
-
37
-
38
-
39
-
40
-
41
-
42
-
43
-
44
-
45
-
46
-
47
-
48
-
 49
49 -
 50
50 -
 51
51 -
 52
52 -
 53
53 -
 54
54 -
 55
55 -
 56
56 -
 57
57 -
 58
58 -
 59
59 -
 60
60 -
 61
61 -
 62
62 -
 63
63 -
 64
64 -
 65
65 -
 66
66
 |
 |

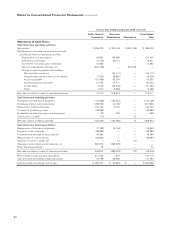
Dollar General Corporation 57
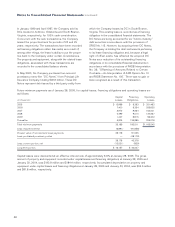
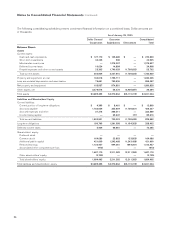
As of January 30, 2004 (Restated)
Dollar General
Corporation
Guarantor
Subsidiaries Eliminations
Consolidated
Total
Balance Sheet:
Assets
Current assets:
Cash and cash equivalents $ 285,007 $ 60,892 $ — $ 345,899
Short-term investments 67,225 1,501 — 68,726
Merchandise inventories — 1,157,141 — 1,157,141
Deferred income taxes 15,412 15,001 — 30,413
Prepaid expenses and other current assets 21,363 2,323,390 (2,294,717) 50,036
Total current assets 389,007 3,557,925 (2,294,717) 1,652,215
Property and equipment, at cost 183,843 1,525,879 — 1,709,722
Less accumulated depreciation and amortization 81,281 670,809 — 752,090
Net property and equipment 102,562 855,070 — 957,632
Other assets, net 3,668,873 41,247 (3,698,850) 11,270
Total assets $4,160,442 $4,454,242 $(5,993,567) $2,621,117
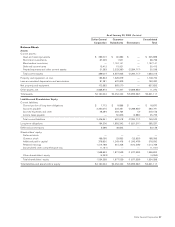
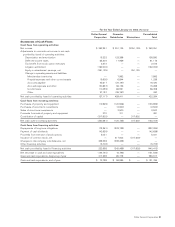
Liabilities and Shareholders’ Equity
Current liabilities:
Current portion of long-term obligations $ 7,772 $ 8,898 $ — $ 16,670
Accounts payable 2,350,375 323,251 (2,289,835) 383,791
Accrued expenses and other 48,394 254,764 (2) 303,156
Income taxes payable — 50,605 (4,880) 45,725
Total current liabilities 2,406,541 637,518 (2,294,717) 749,342
Long-term obligations 194,306 1,892,342 (1,821,311) 265,337
Deferred income taxes 5,296 46,843 — 52,139
Shareholders’ equity:
Preferred stock — — — —
Common stock 168,095 23,853 (23,853) 168,095
Additional paid-in capital 376,930 1,243,478 (1,243,478) 376,930
Retained earnings 1,014,788 610,208 (610,208) 1,014,788
Accumulated other comprehensive loss (1,161) — — (1,161)
1,558,652 1,877,539 (1,877,539) 1,558,652
Other shareholders’ equity (4,353) — — (4,353)
Total shareholders’ equity 1,554,299 1,877,539 (1,877,539) 1,554,299
Total liabilities and shareholders’ equity $ 4,160,442 $4,454,242 $(5,993,567) $ 2,621,117