Dollar General 2004 Annual Report Download - page 18
Download and view the complete annual report
Please find page 18 of the 2004 Dollar General annual report below. You can navigate through the pages in the report by either clicking on the pages listed below, or by using the keyword search tool below to find specific information within the annual report.-
 1
1 -
2
-
3
-
4
-
5
-
6
-
7
-
 8
8 -
 9
9 -
 10
10 -
 11
11 -
 12
12 -
 13
13 -
 14
14 -
 15
15 -
 16
16 -
 17
17 -
 18
18 -
 19
19 -
 20
20 -
 21
21 -
 22
22 -
 23
23 -
 24
24 -
 25
25 -
 26
26 -
 27
27 -
 28
28 -
29
-
30
-
31
-
32
-
33
-
34
-
35
-
36
-
37
-
38
-
39
-
40
-
41
-
42
-
43
-
44
-
45
-
46
-
47
-
48
-
49
-
50
-
51
-
52
-
53
-
54
-
55
-
56
-
57
-
58
-
59
-
60
-
61
-
62
-
63
-
64
-
65
-
66
 |
 |

16
Management’s Discussion and Analysis of Financial Condition
and Results of Operations (continued)
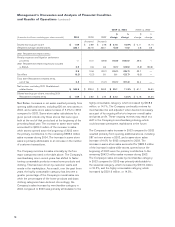
2004 vs. 2003 2003 vs. 2002
(Amounts in millions, excluding per share amounts) 2004 2003 2002
$
change
%
change
$
change
%
change
(Restated) (Restated)
Diluted earnings per share $ 1.04 $ 0.89 $ 0.78 $ 0.15 16.9% $ 0.11 14.1%
Weighted average diluted shares 332.1 337.6 335.1 (5.6) (1.6) 2.6 0.8
2001 Restatement-related items:
Penalty expense and litigation settlement
proceeds —10.0 (29.5) (10.0) (100.0) 39.5 —
2001 Restatement-related expenses included
in SG&A 0.5 0.6 6.4 (0.1) (23.5) (5.8) (90.8)
0.5 10.6 (23.1) (10.1) (95.7) 33.7 —
Tax effect (0.2) (0.2) 9.1 0.1 (23.7) (9.3) —
Total 2001 Restatement-related items,
net of tax 0.3 10.4 (14.1) (10.1) (97.3) 24.4 —
Net income, excluding 2001 Restatement-
related items $ 344.5 $ 309.4 $ 248.3 $ 35.1 11.3% $ 61.1 24.6%
Diluted earnings per share, excluding 2001
Restatement-related items $ 1.04 $ 0.92 $ 0.74 $ 0.12 13.0% $ 0.18 24.3%
Net Sales. Increases in net sales resulted primarily from
opening additional stores, including 620 net new stores in
2004, and a same-store sales increase of 3.2% for 2004
compared to 2003. Same-store sales calculations for a
given period include only those stores that were open
both at the end of that period and at the beginning of the
preceding fiscal year. The increase in same-store sales
accounted for $204.0 million of the increase in sales
while stores opened since the beginning of 2003 were
the primary contributors to the remaining $585.0 million
sales increase during 2004. The increase in same-store
sales is primarily attributable to an increase in the number
of customer transactions.
The Company monitors its sales internally by the four
major categories noted in the table above. The Company’s
merchandising mix in recent years has shifted to faster-
turning consumable products versus home products and
clothing. This has been driven by customer wants and
needs in the marketplace. As a result, over the past three
years the highly consumable category has become a
greater percentage of the Company’s overall sales mix
while the percentages of the home products and basic
clothing categories have declined. Accordingly, the
Company’s sales increase by merchandise category in
2004 compared to 2003 was primarily attributable to the
highly consumable category, which increased by $618.2
million, or 14.7%. The Company continually reviews its
merchandise mix and adjusts it when deemed necessary
as a part of its ongoing efforts to improve overall sales
and gross profit. These ongoing reviews may result in a
shift in the Company’s merchandising strategy which
could increase permanent markdowns in the future.
The Company’s sales increase in 2003 compared to 2002
resulted primarily from opening additional stores, including
587 net new stores in 2003, and a same-store sales
increase of 4.0% for 2003 compared to 2002. The
increase in same-store sales accounted for $228.3 million
of the increase in sales while stores opened since the
beginning of 2003 were the primary contributors to the
remaining $543.3 million sales increase during 2003.
The Company’s sales increase by merchandise category
in 2003 compared to 2002 was primarily attributable to
the seasonal category, which increased by $161.9 million,
or 16.3%, and the highly consumable category, which
increased by $531.9 million, or 14.5%.